
What Pregnancy Intent Reveals About the Abortion Arc
Comparing pregnancy intent with outcome explains both the 1970s abortion surge and the post-1990 decline.
Previously, we explored the surge in the rate of unintended pregnancy that occurred in the wake of the so-called “sexual revolution.” Unintended pregnancies per woman of reproductive age per year surged in the 1970s, crested in the 1980s, and slowly declined until the 2010s.
That analysis required my weight adjustment for abortion under-reporting in the National Survey of Family Growth (NSFG) data.
The analysis and the adjustment together surface two variables: pregnancy outcome and pregnancy intent. Comparing those two variables with each other illuminates both the dramatic surge in the number of abortions in the 1970s and the long, gradual decline in abortions after 1990.
Intent and Outcome
Figure 1 illustrates that unintended pregnancies account for a far greater proportion of induced abortions than live births.
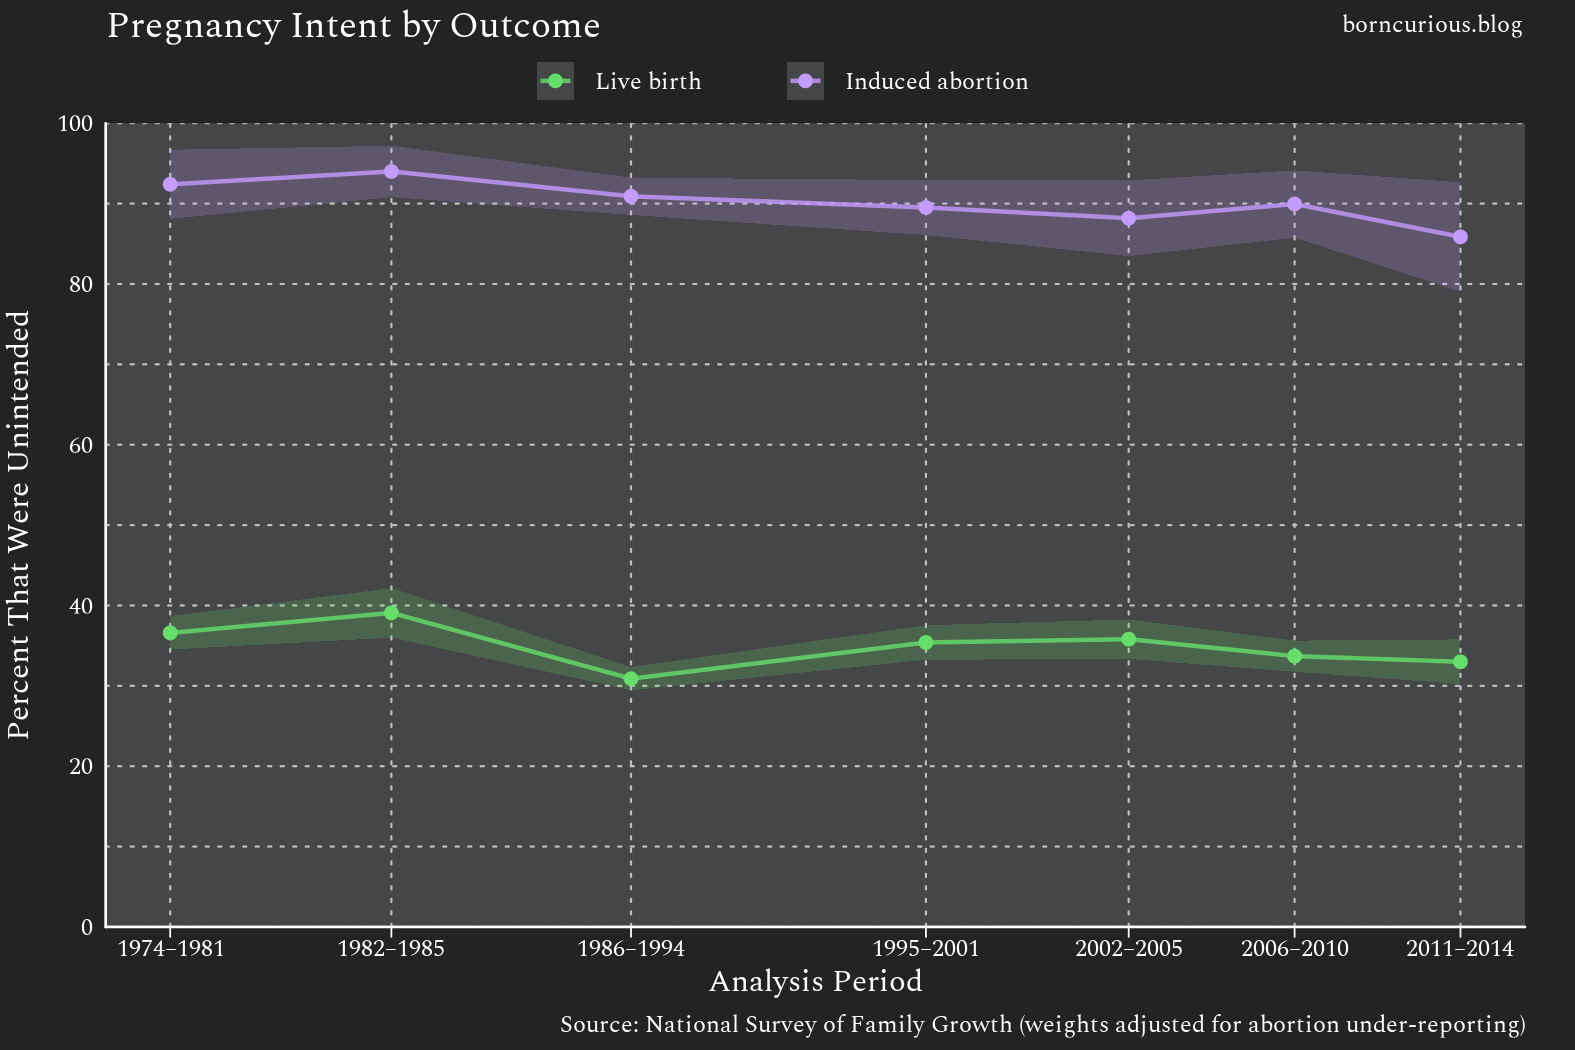
Of live births, about 30% to 40% began as unintended pregnancies over four decades.
Among induced abortions, more than 90% started as unintended pregnancies in the 1970s and 1980s, after which a slight declining trend may be present, but this is obscured by sampling error.
Figure 2 looks only at pregnancies that end in induced abortion.
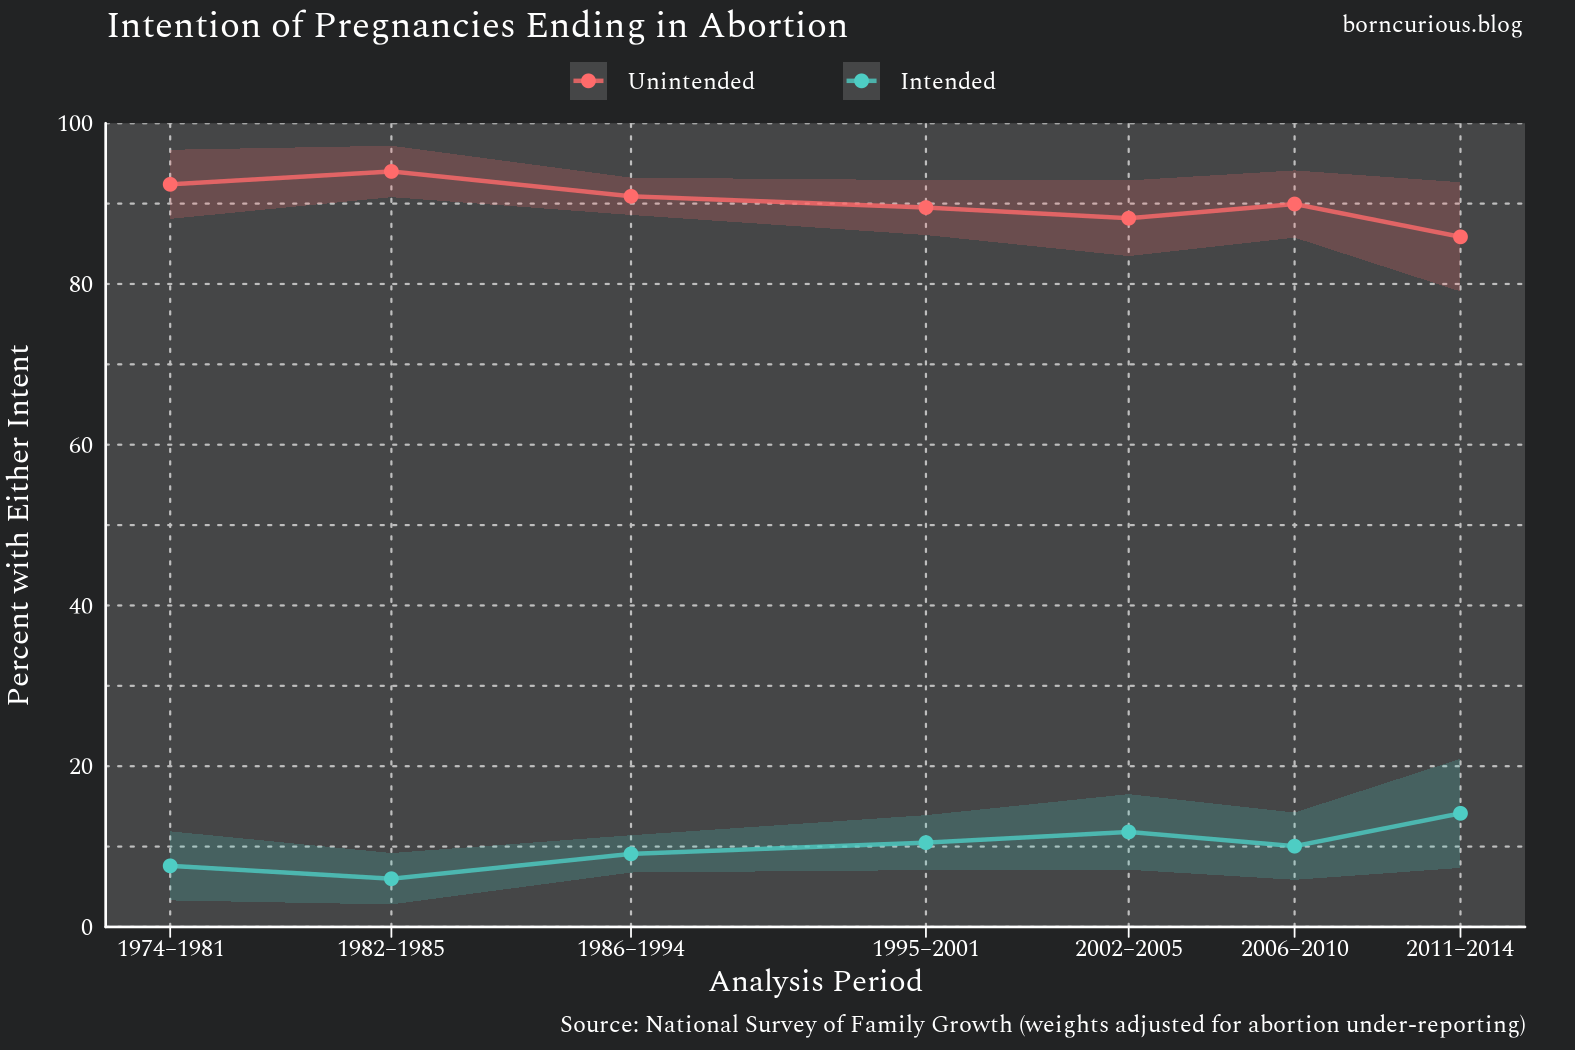
This illustrates why the abortion under-reporting adjustment is especially needed for trend analysis of unintended pregnancies. The adjustment has a relatively small impact on estimates of intended pregnancies because relatively few intended pregnancies are ended by induced abortion.
However, the difference in the rate of induced abortion between unintended and intended pregnancies might be narrowing ever so slightly.
Intended Pregnancies
Let us look at the converse comparison. Figure 3 illustrates trends in pregnancy outcomes for intended pregnancies.
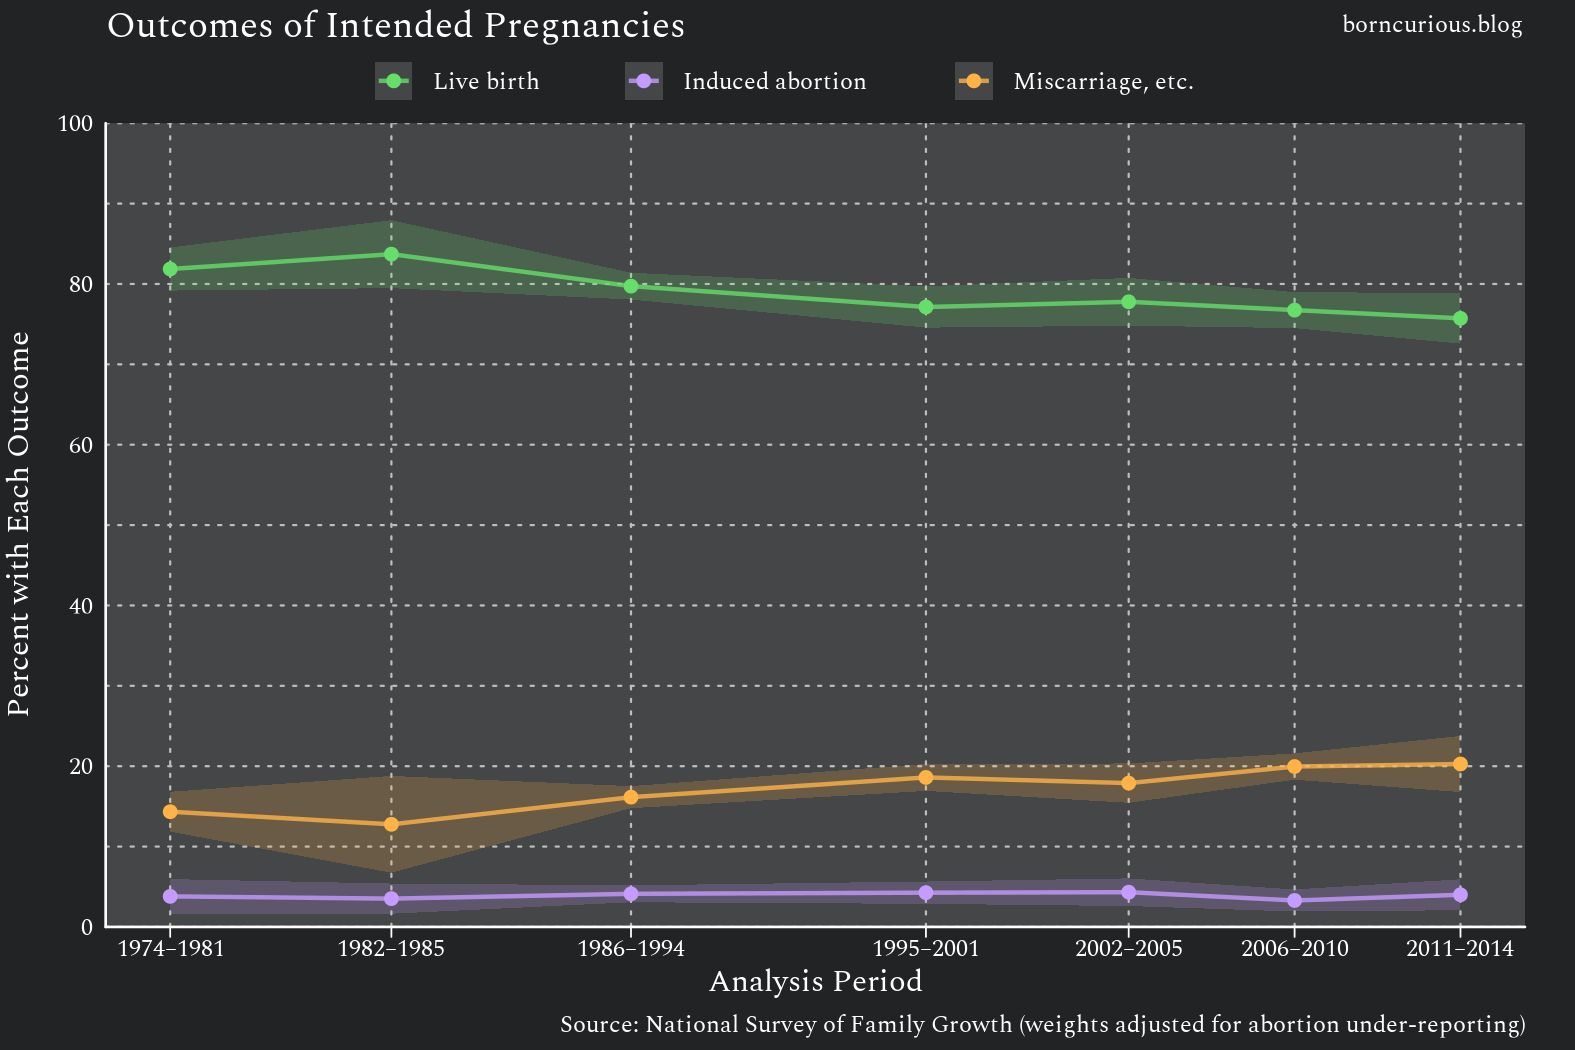
The proportion of intended pregnancies ended by induced abortion is small (less than 5%) and flat (no obvious increasing or decreasing trend). The proportion ending with live birth appears to be declining slightly, but that is attributable to an increasing trend in miscarriages, etc.
Why the Miscarriage Trend Is Misleading
We should not put too much stock in supposed trends in the miscarriage rate. These are trends in the noticed miscarriage rate. Most miscarriages go unnoticed, especially those that occur early in pregnancy.
The best evidence of what proportion of miscarriages go unnoticed comes from studies in which women are given repeated human chorionic gonadotropin (hCG) assays. (Jarvis, 2017)
Most of us are familiar with hCG assays because home pregnancy tests are simple versions of them. Studies using more sensitive assays find that the majority of miscarriages are subclinical and would likely have gone unnoticed without testing. (Wilcox et al., 1988; Wang et al., 2003)
However, these studies use convenience samples, which are inherently unrepresentative of larger populations. Therefore, the results do not generalize, and we should not put too much stock in the specific numbers found.
The important takeaway is that the apparent increase in miscarriage rate is likely just an increase in miscarriage detection. More and more hCG testing options, including those that integrate with apps that monitor menstrual cycles, are becoming available to consumers. As these options become more sophisticated and are used more often, more miscarriages will be detected.
Figure 4 repeats Figure 3, but excludes miscarriages, ectopic pregnancies, and stillbirths.
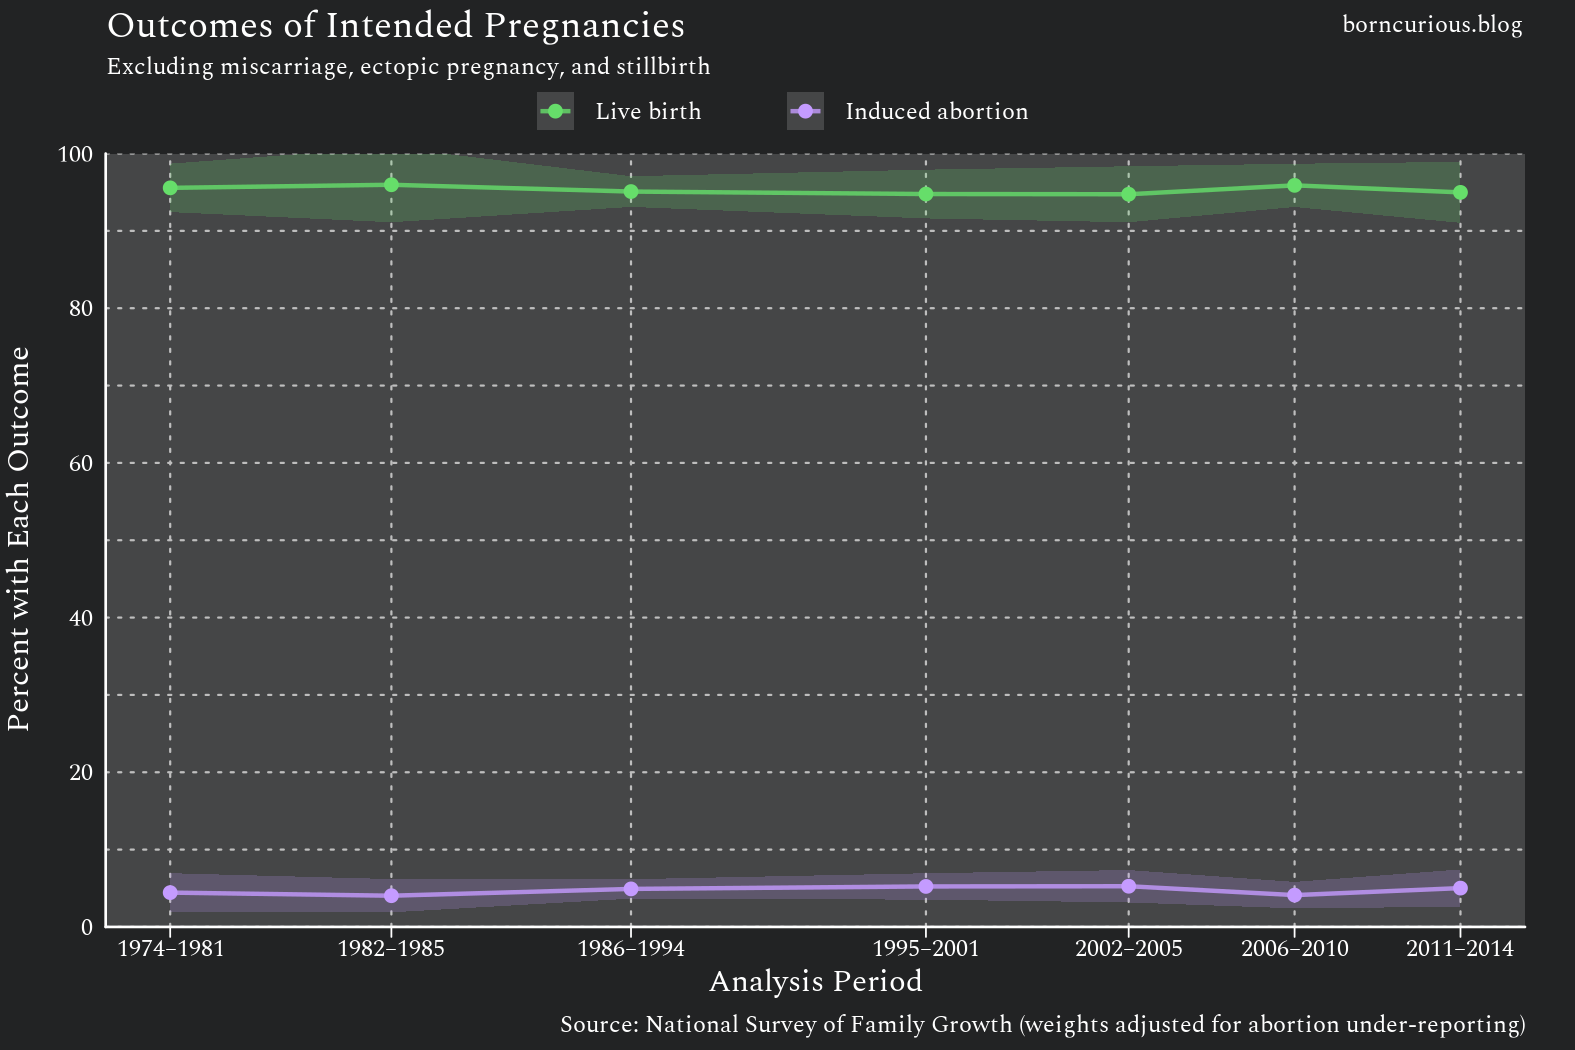
We can see that there is no trend in the outcomes for intended pregnancies if we accept the hypothesis that miscarriage detection is increasing.
Unintended Pregnancies
Now, let us take a look at unintended pregnancies.
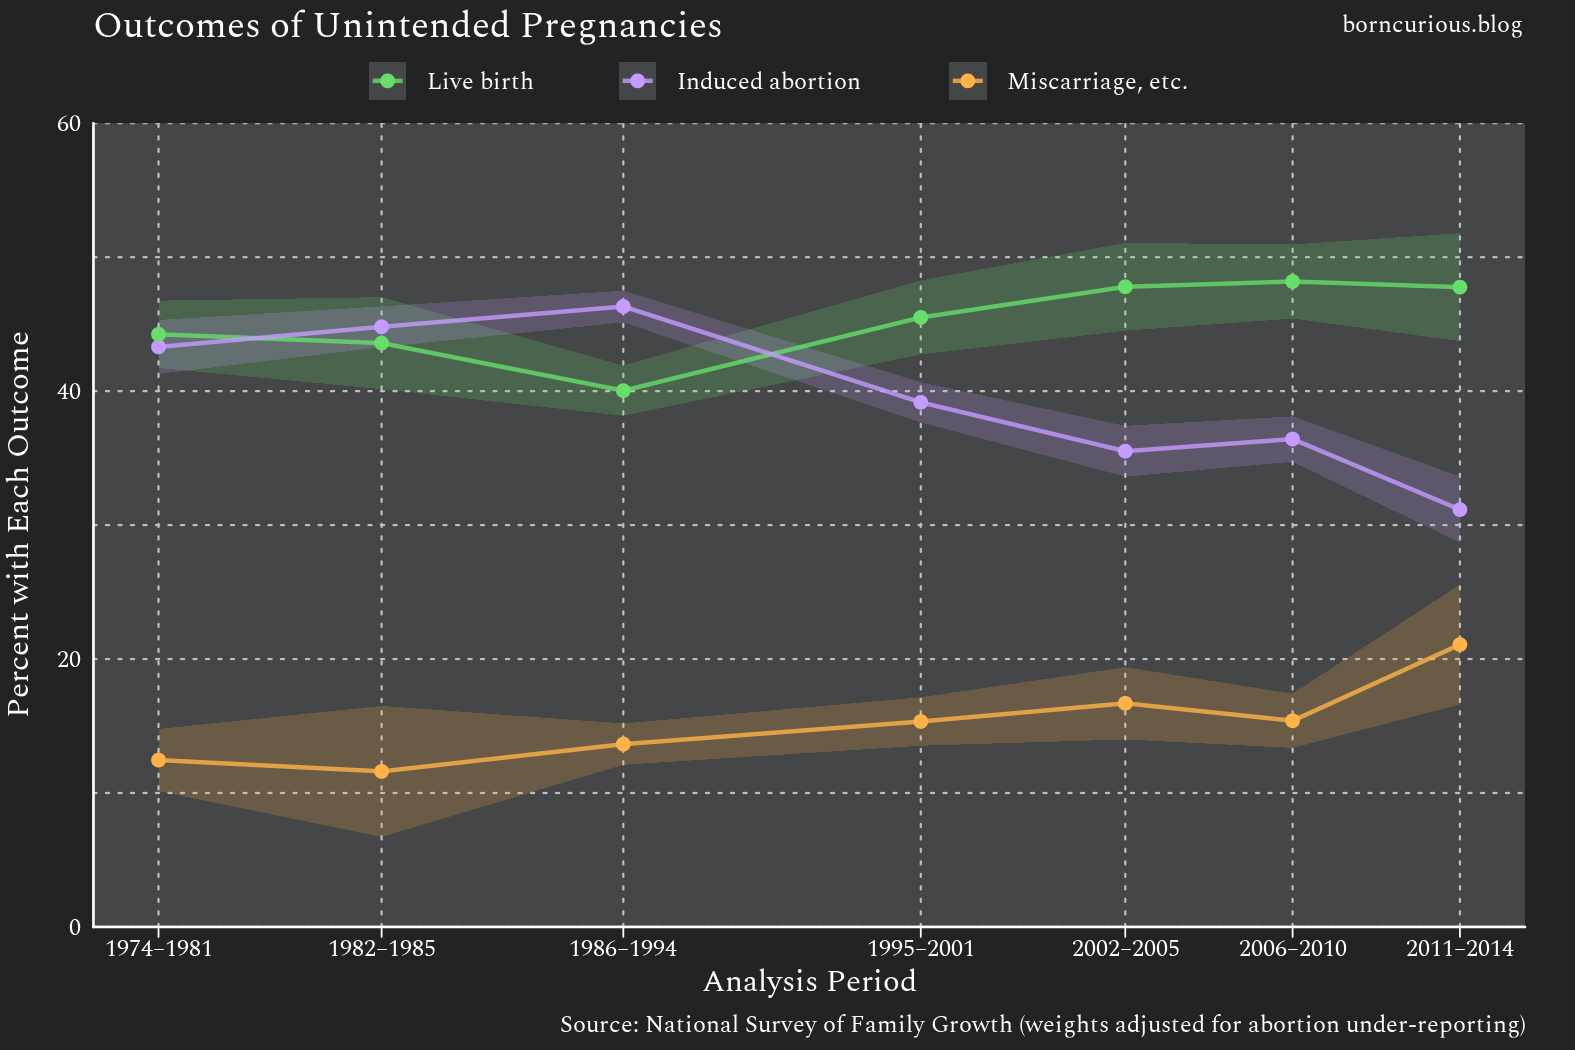
There does appear to be a trend here in Figure 5, unlike for intended pregnancies. However, we once again see the apparent increasing trend in miscarriages, likely due to increased detection of miscarriage. Let us consider just pregnancies that end in live birth or are ended by induced abortion in Figure 6.
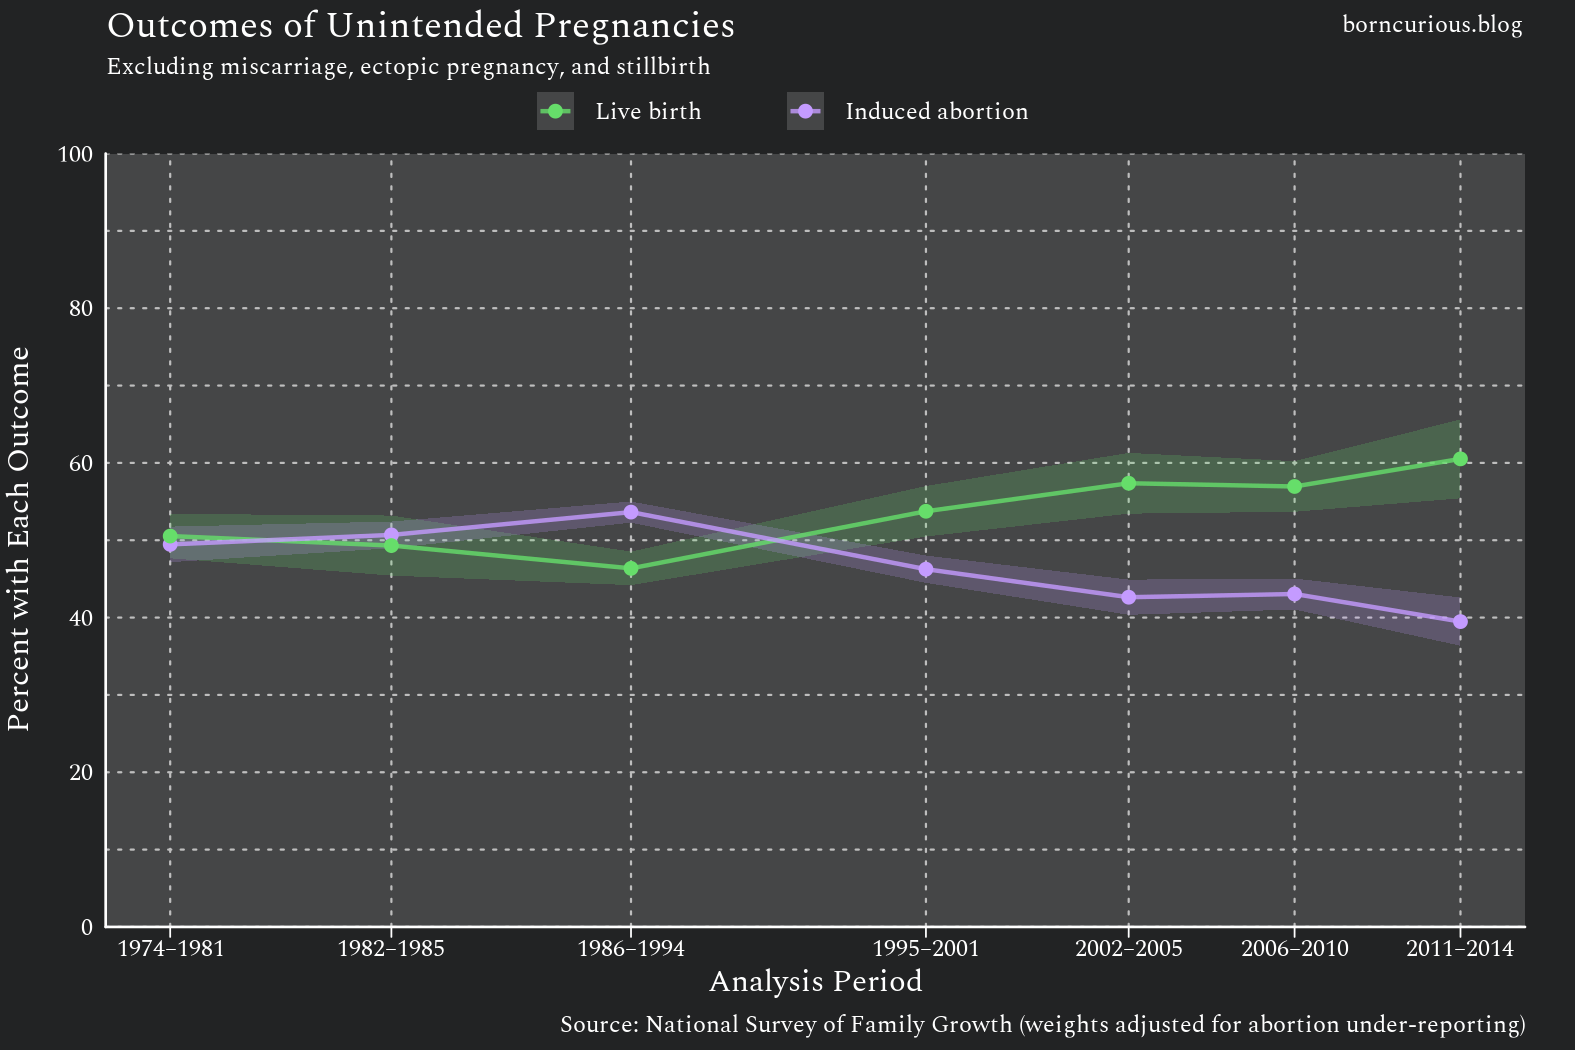
During the surge in unintended pregnancies in the wake of the sexual revolution, unintended pregnancies were split almost evenly in outcome between live birth and induced abortion. In the late 1980s and early 1990s, unintended pregnancies were slightly more likely to be ended by induced abortion than to end in live birth.
However, since then, there has been a reversal of the trend such that unintended pregnancies are becoming less likely to be ended by induced abortion and more likely to result in live birth. In the most recent NSFG complete data set,1 the split is 60/40 in favor of live birth.
Explaining Both Ends of the Abortion Arc
After this and the preceding analysis, we now have a much better understanding of the components of the trends in total induced abortions in the United States after Roe v. Wade and Doe v. Bolton, as seen in the Guttmacher Institute’s Abortion Provider Census (APC) data. These trends are summarized in Figure 7.
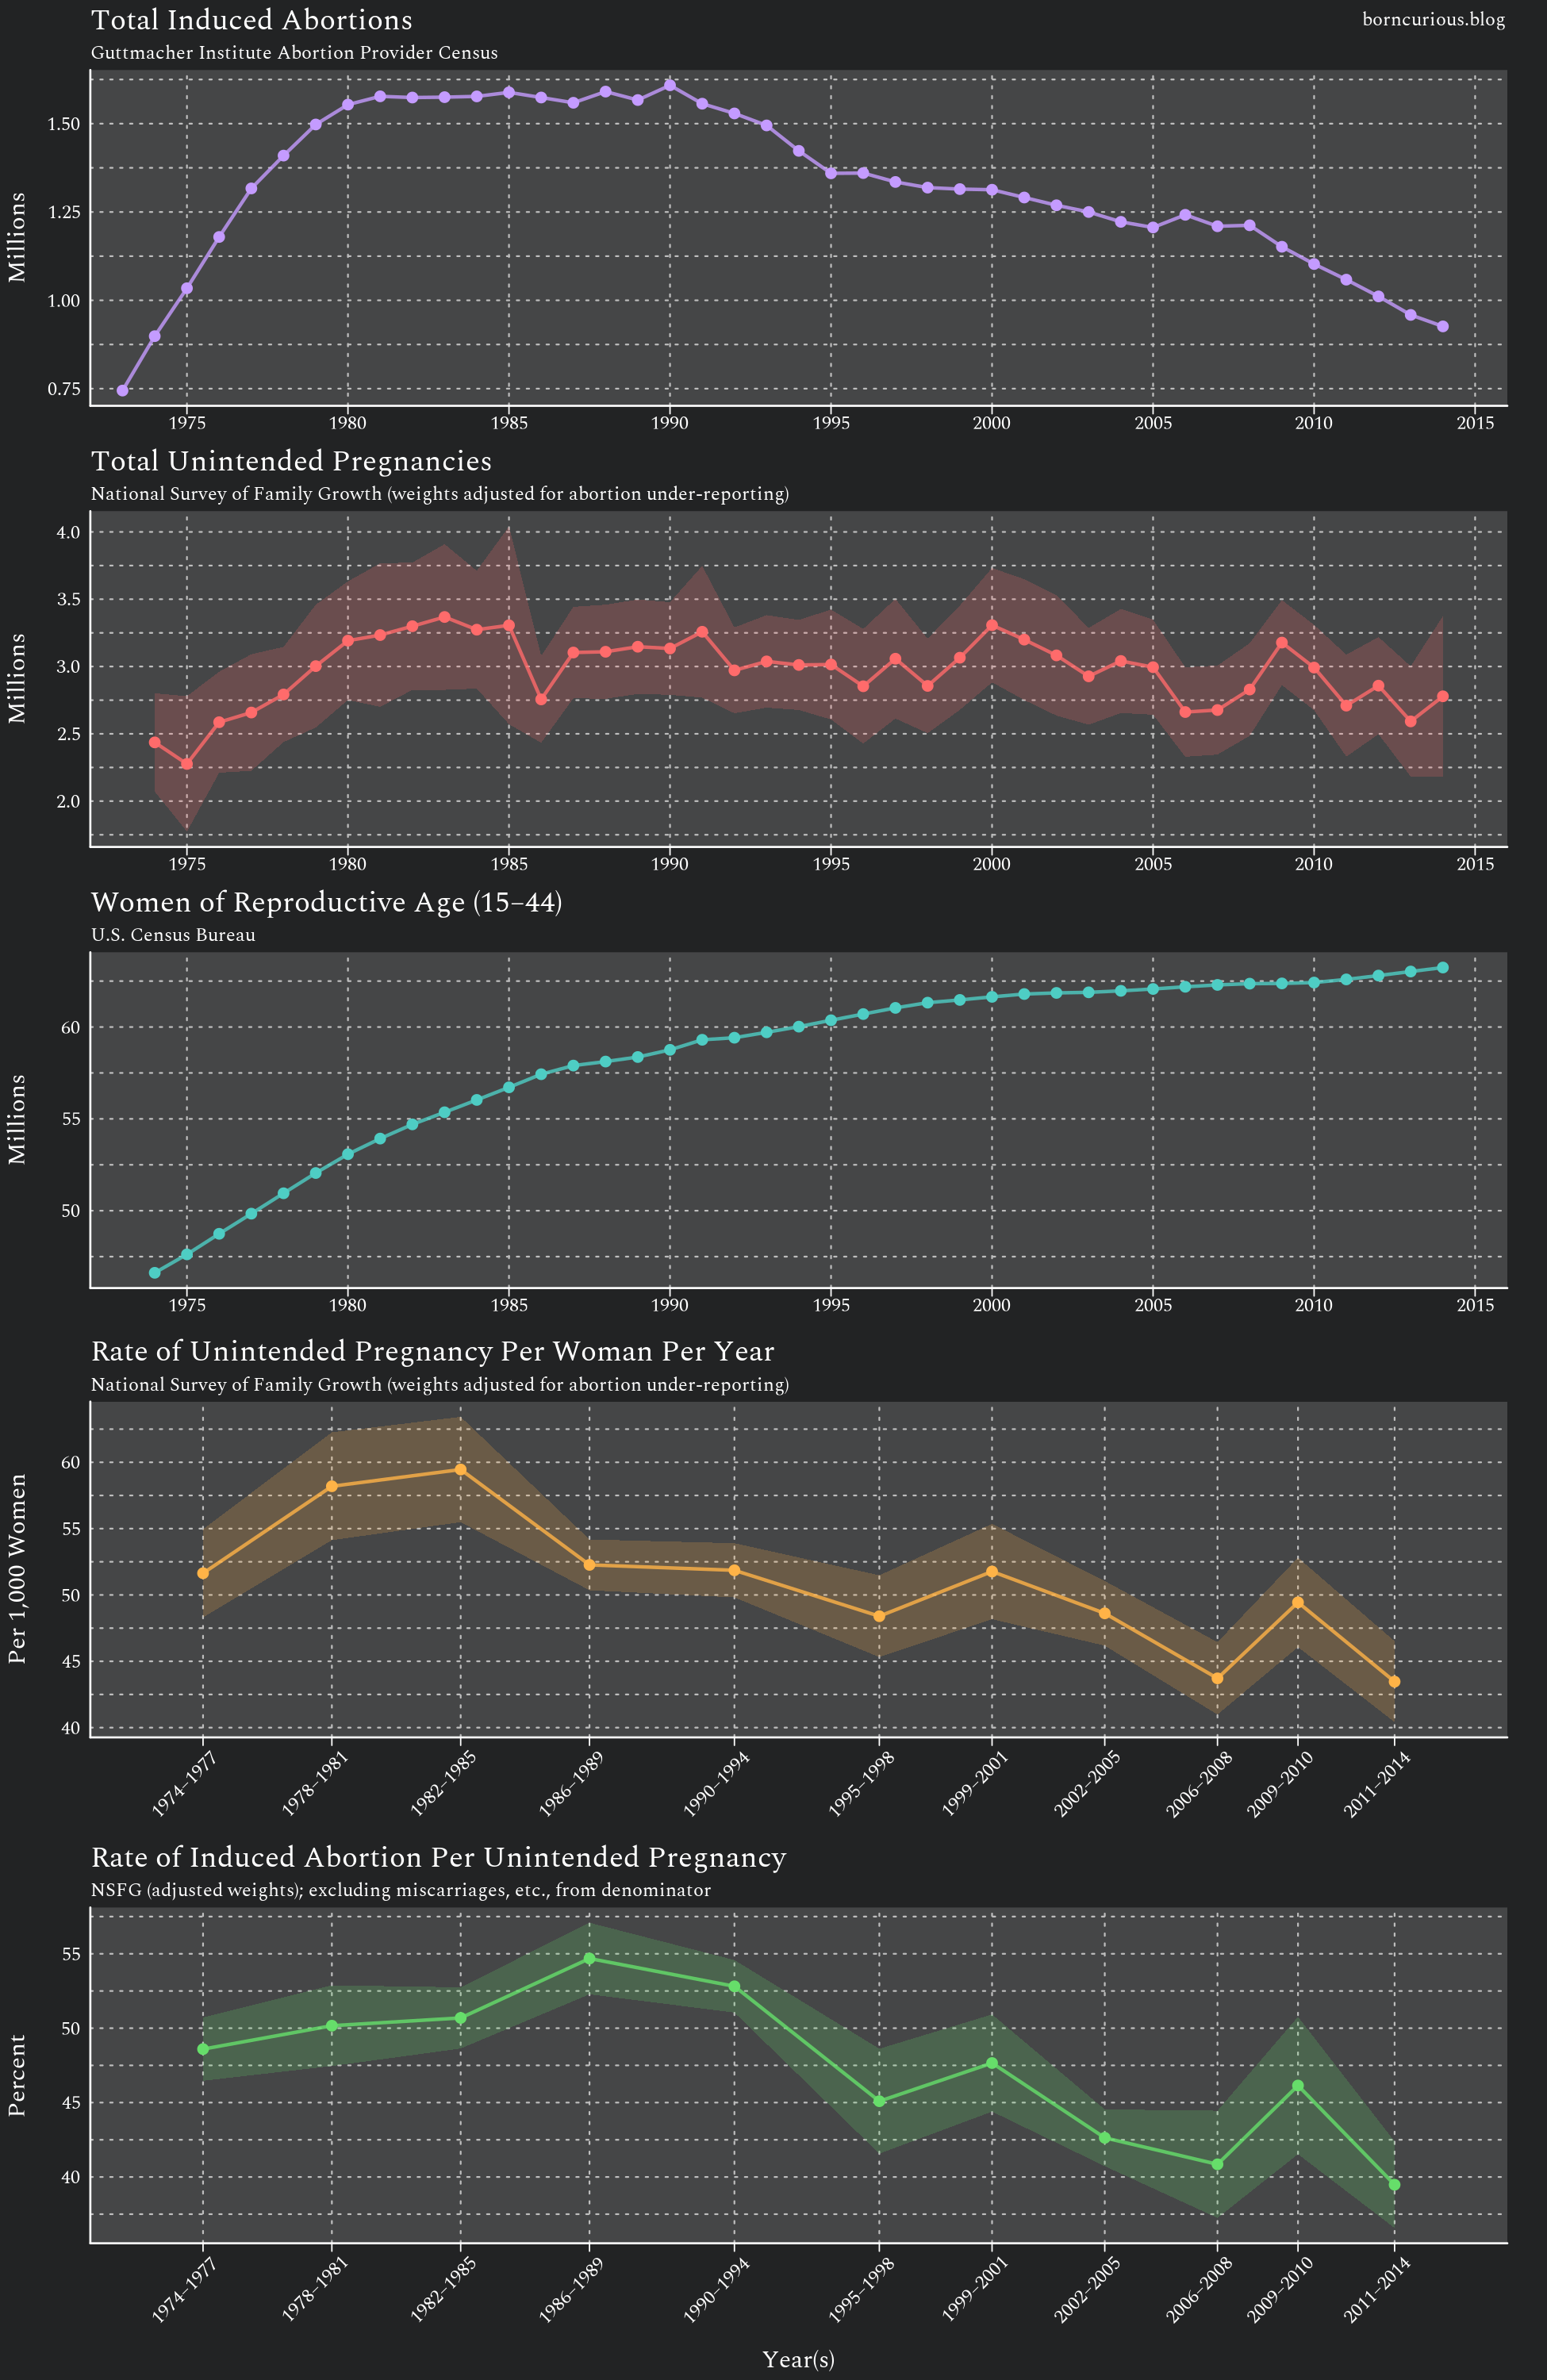
The number of induced abortions per year in the United States surged in the 1970s, crested in the 1980s, and started to decline gradually in the 1990s. (Panel 1) This is the titular “arc.”
The trend in the total number of unintended pregnancies per year is similar at first, surging in the 1970s and cresting in the 1980s. However, this trend does not decline as dramatically as the number of induced abortions did. In fact, the total number of unintended pregnancies is more or less level (within sampling error) from 1987 on. (Panel 2)
So what is going on here?
There are two contradictory trends. Throughout this period, the number of women of reproductive age in the United States increased. (Panel 3) From the mid-1980s on, the rate of unintended pregnancy per woman per year decreased. (Panel 4) These two trends combine to produce a roughly constant number of total unintended pregnancies per year from about 1987 on.
So if the total number of unintended pregnancies per year is more or less constant past 1987, how do we see the declining trend in induced abortions per year from 1990 on? (Panel 1)
There are two drivers. First, the rate of unintended pregnancy per woman continued to decline past 1987. (Panel 4) This decline is not visible in total unintended pregnancies (Panel 2) because it is offset by the continued growth in the number of women of reproductive age. (Panel 3) Second, the rate at which unintended pregnancies were ended by induced abortion also declined from about 1990 on. (Panel 5) Together, fewer unintended pregnancies per woman and a lower propensity to abort them combined to produce the declining trend in total induced abortions.
The surge in the number of induced abortions per year in the 1970s was dramatic. In 1974, there were 898,570 induced abortions compared with 1,577,340 in 1981, according to APC data.
During this time, the increase in the rate at which unintended pregnancies were ended by induced abortion was relatively small and within sampling error, going from 48.6% (±2.1%) in 1974-1977 to 50.7% (±2.1%) in 1982-1985.
However, the increase in the unintended pregnancy rate was more dramatic, going from 51.6 (±3.3) per 1,000 women in 1974-1977 to 59.5 (±4.0) in 1982-1985. The increase in the total number of women of reproductive age was also dramatic, going from 46.6 million in 1974 to 53.9 million in 1981.
The increase in the rate of induced abortion per unintended pregnancy was small and may just be sampling variation. Most of the surge in abortions in the 1970s came from the increase in the rate of unintended pregnancy per woman and the increase in the number of women of reproductive age.
The abortion surge followed from the surge in unintended pregnancies. The abortion decline required both fewer unintended pregnancies and a lower propensity to abort them.
Methodological Issues
Abortion Under-reporting
These results depend on the assumption that the induced abortions reported on the NSFG are representative of the abortions that are not reported.
As I discussed in the previous analysis, the abortion under-reporting in the NSFG is so severe that less than half of pregnancies ended by induced abortion are reported in the NSFG. Because of this, the official documentation advises us not to use the NSFG for substantive analysis of covariates of induced abortion.
This is because the assumption that the reported abortions are representative of the unreported ones is almost certainly false for most covariates. The subpopulation of women reporting abortions is likely different from the subpopulation not reporting abortions in important ways.
However, for this specific analysis, the relevant question is not whether non-reporters differ from reporters in general; it is whether they differ in one specific respect: the proportion of their abortions that ended unintended pregnancies versus intended pregnancies. This is a narrower assumption than representativeness in general, and it is the only dimension of unrepresentativeness that can affect these results.
This is actually a much safer assumption, since the vast majority of induced abortions end unintended pregnancies. As we saw in Figure 2, based on abortions reported in the NSFG, ~90% of induced abortions end unintended pregnancies, whereas only ~10% end intended pregnancies. Even if the proportions differ among the unreported abortions, it is likely that the proportion that end unintended pregnancies is much greater than the proportion that end intended pregnancies.
Because of this, the estimates in this analysis might be biased (in the statistical sense) due to abortion under-reporting, but the magnitude of this bias is unlikely to be sufficient to change the conclusions.
Furthermore, the trend analysis in this article is on even better ground. A fixed bias in the composition of unreported abortions would shift the estimated levels up or down but would leave the trend intact. For the observed decline in abortion per unintended pregnancy to be untrue, the bias would have to change across survey cycles. The unreported fraction would need to shift systematically toward or away from unintended pregnancies over time in a way that mimics a real trend.
Therefore, in this specific case, I think it is sound to use NSFG for data to analyze trends in pregnancy intent versus outcomes, including induced abortion.
Nonetheless, because of the abortion under-reporting problem, this is likely the last analysis of abortion covariates based on NSFG data that you will find on Born Curious.
Pooling Estimates Across Years
In the previous analysis, I generated estimates for the various quantities per year. This was more feasible because the NSFG samples were being narrowed to subsamples based on a single variable: pregnancy intent.
The perceptive reader will notice that the estimates in this analysis are not generated on a per-year basis. This is because the subsamples used to estimate them were restricted by two variables simultaneously, pregnancy intent and pregnancy outcome, thereby reducing their size considerably. Annual estimates led to confidence intervals that were too wide to support reliable inference.
To address this, estimates were pooled across multi-year periods. For Figures 1 through 6, the pooling follows the “analysis periods” that correspond to the time periods assigned to each NSFG cycle. For Figure 7, to make the estimates comparable to the annual quantities, the estimates were pooled over periods of no more than 4 years.
Citations
Jarvis, G. E. (2017). Early embryo mortality in natural human reproduction: What the data say. F1000Research, 5, 2765. https://doi.org/10.12688/f1000research.8937.2
Wang, X., Chen, C., Wang, L., Chen, D., Guang, W., & French, J. (2003). Conception, early pregnancy loss, and time to clinical pregnancy: A population-based prospective study. Fertility and Sterility, 79(3), 577–584. https://doi.org/10.1016/S0015-0282(02)04694-0
Wilcox, A. J., Weinberg, C. R., O’Connor, J. F., Baird, D. D., Schlatterer, J. P., Canfield, R. E., Armstrong, E. G., & Nisula, B. C. (1988). Incidence of Early Loss of Pregnancy. New England Journal of Medicine, 319(4), 189–194. https://doi.org/10.1056/NEJM198807283190401
The 2022-2023 survey data are out, but I am waiting until the 2024-2025 data are released before using these data in my analyses. Also, I have written about the issues in the methodological changes between the 2017-2019 and 2022-2023 surveys.