
Crime Statistics Are Better Than Ever—And Still Terrible
Police reporting has improved dramatically, but most crimes still never make it into official statistics
Recently, I was chatting with a man who had retired as a firefighter in Alexandria, Virginia—a city across the Potomac River from Washington, D.C. He recounted how, as a young man, he had moved from Fredericksburg, Virginia, to the hip area of Old Town Alexandria with his newly married wife. They were excited to move from the countryside to the big city.

They only lived in Old Town Alexandria for 2 years. During that time, between the two of them, they called 911, he guessed, about 50 times. Most of the time, it was for property crimes—people breaking into cars, etc. But on 4 or 5 occasions, it was because of violence with firearms.
When his wife first called 911 in response to gunshots, the 911 operator dissuaded her. “You are probably just hearing fireworks.” At first, his wife believed the 911 operators. But on a subsequent incident, his wife found spent shell casings on the street the next day, and she realized the 911 operator was gaslighting her.
Three Ways Crime Statistics Fall Short
The incidence of actual crime is much greater than the incidence reported in crime statistics. However, crime statistics have improved remarkably in recent decades.
Crime statistics undercount crime for three major reasons:
Most crimes are not reported to the authorities.
The authorities, when crimes are reported to them, sometimes do not process the crimes.
The authorities, when processing some crimes, downgrade the severity of the crimes.
The Stark Gap Between Real and Reported Crime
We can measure the extent to which 1 and 2 occur. For crimes in the United States at the national level, we have two main instruments:
The Uniform Crime Reporting (UCR) Program of the Federal Bureau of Investigation (FBI)
The National Crime Victimization Survey (NCVS) of the Bureau of Justice Statistics (BJS)
The UCR collects statistics from the approximately 18,000 police agencies in the United States. Participation in the program is voluntary, with approximately 95% of police agencies participating.
Each year, the BJS selects a representative sample of approximately 150,000 households in the United States and administers the NCVS to all members of the chosen households aged 12 or older. The NCVS asks each respondent about criminal victimizations experienced in the preceding 6 months.1
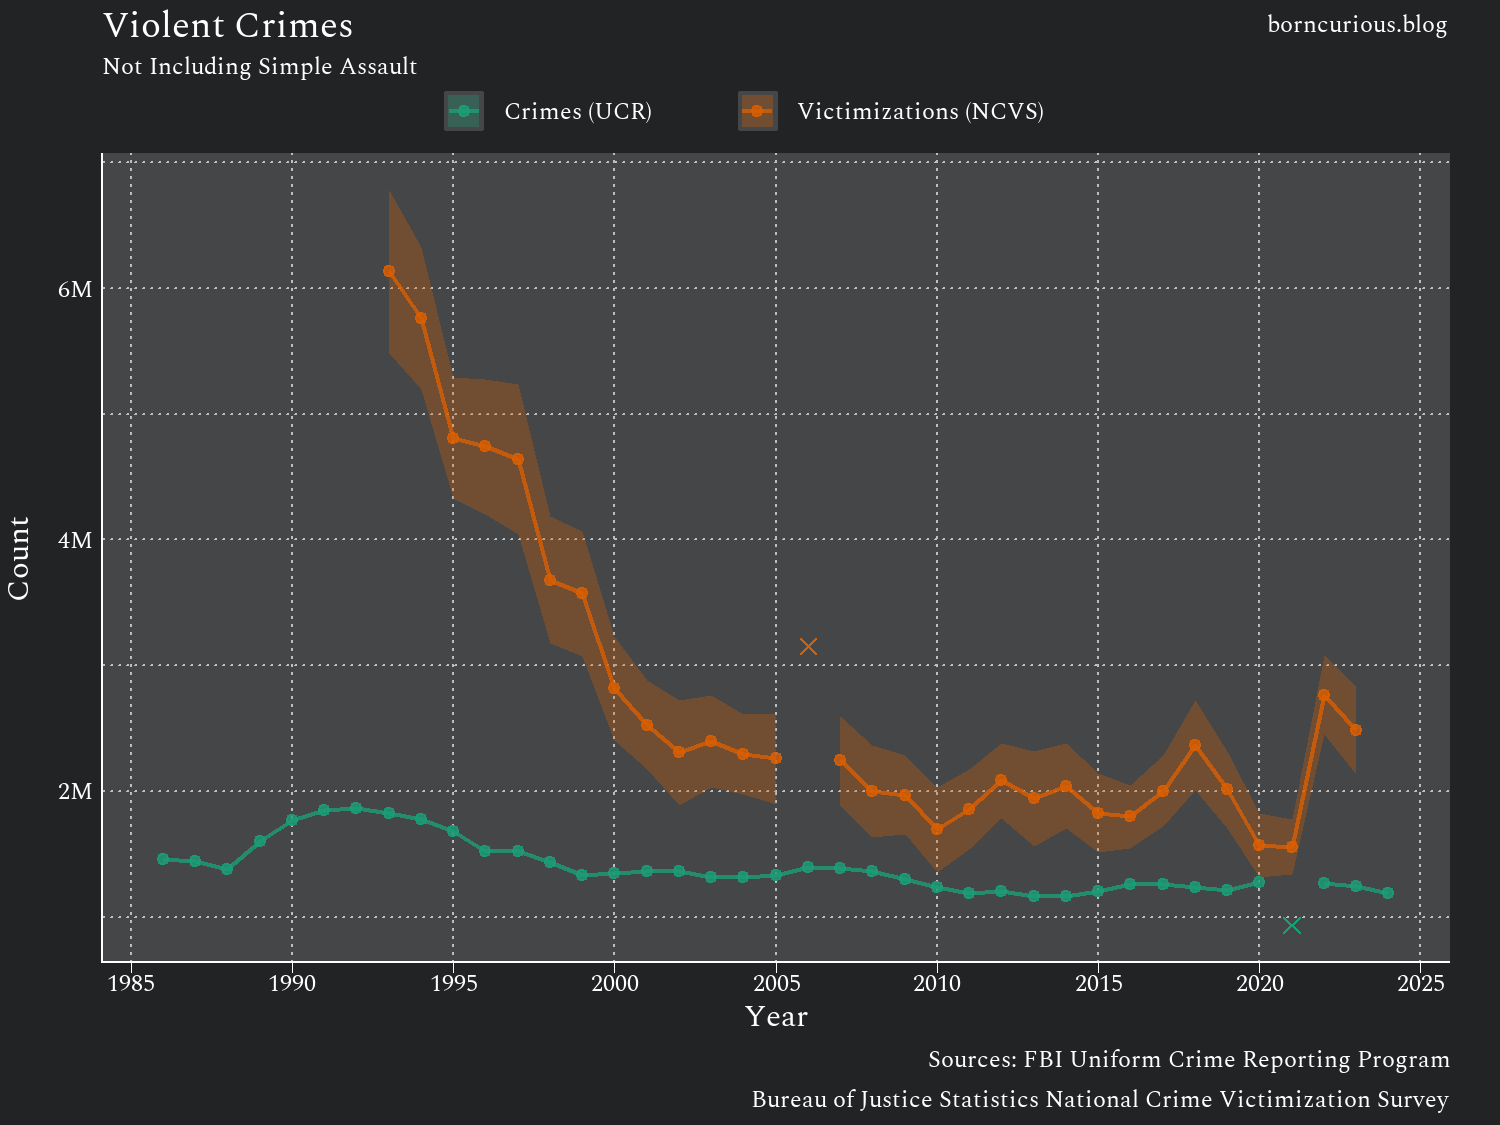
Figure 1 shows the estimated number of violent crimes in the United States based on UCR and NCVS data. The UCR data were taken from the FBI’s Crime Data Explorer (CDE), and the NCVS data were taken from the NCVS Dashboard (N-DASH).2
It is well known that crime peaked in the 1990s. You can sort of see this in the UCR data. According to the UCR, there were 1,376,611 violent crimes in 1988, and this increased year by year until 1992, when it peaked at 1,867,287.
However, at the same time that the UCR reported 1,822,382 violent crimes in 1993, the NCVS estimated about 6.1 million violent crimes. Indeed, next to the plot of the NCVS data, the UCR plot almost looks flat.
What is going on here?
Most Victims Never Call the Police
The NCVS asks its respondents whether they reported each victimization to the police. Most are not reported. This underreporting is even worse for property crimes than for violent crimes, but even with violent crimes, only between 40% and half of the victims report the crime to the authorities.
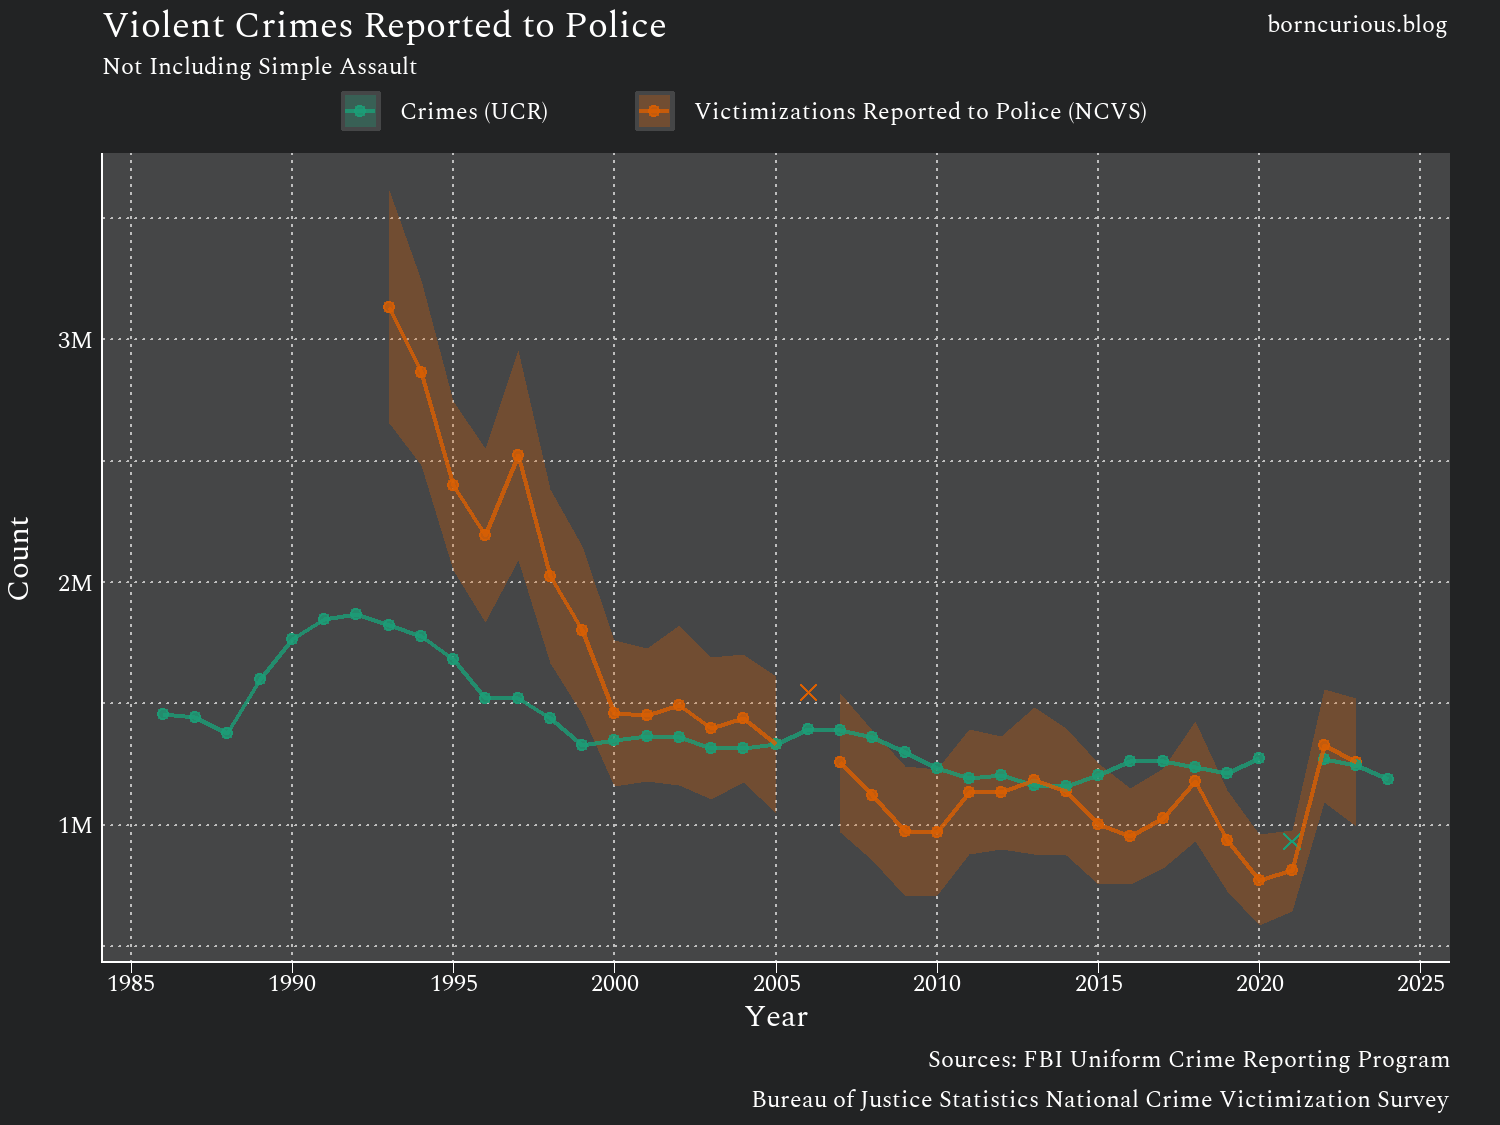
Figure 2 plots the same UCR data, but against NCVS estimates of reported violent victimizations reported to the authorities.
There is still a large gap in 1993 between 3.1 million reported violent victimizations from the NCVS and the UCR’s 1,822,382 violent crimes. It seems like the authorities neglected 1.3 million violent crimes reported to them.3 Still, these 1.3 million crimes that the authorities neglected are less than the approximately 3 million crimes not reported to the authorities in the first place.
Closing the Gap: Police Reporting Gets Better
Something interesting happened in the year 2000. The gap between victimizations reported to the police from the NCVS and police agencies’ reporting of crimes to the UCR went away. The difference between the two lies within the sampling error of the NCVS, as indicated by the 95% confidence interval band plotted around the NCVS estimates.
The United States, as a nation, has largely solved the problem of authorities underreporting crime in their statistics in the 21st century. Of course, this is only the case when crime is aggregated at the national level; any specific locality might still be underrepresenting crime occurring within its jurisdiction.
The problem of victims not reporting crimes to the authorities remains, however. In the 21st century, this accounts for nearly all of the crime statistics underreporting, at least at the national level.
Why It Got Better
The fact that UCR crime statistics plot as a nearly flat horizontal line hints at one reason for the authorities’ underreporting of crime in the 20th century. The UCR likely measures the amount of throughput police agencies have for processing crime. The high crime rate at the end of the 20th century may have saturated the system.
During the 1990s, in response to the large discrepancy between real and reported crime, there were several political initiatives to improve crime reporting. For instance, the New York Police Department launched CompStat in 1994, which led to greater transparency and accountability and was imitated by many police agencies across the country.
The convergence of the two lines in Figure 2 thus represents the confluence of two trends:
Actual crime decreased, reaching more manageable levels.
Police reporting of crime improved.
A Classification Problem
You may notice that the NCVS estimates of violent victimizations reported to police are actually lower than the UCR crime statistics in some years, e.g., 2016, 2019, and 2020. How can this be?
This is almost certainly a classification problem.
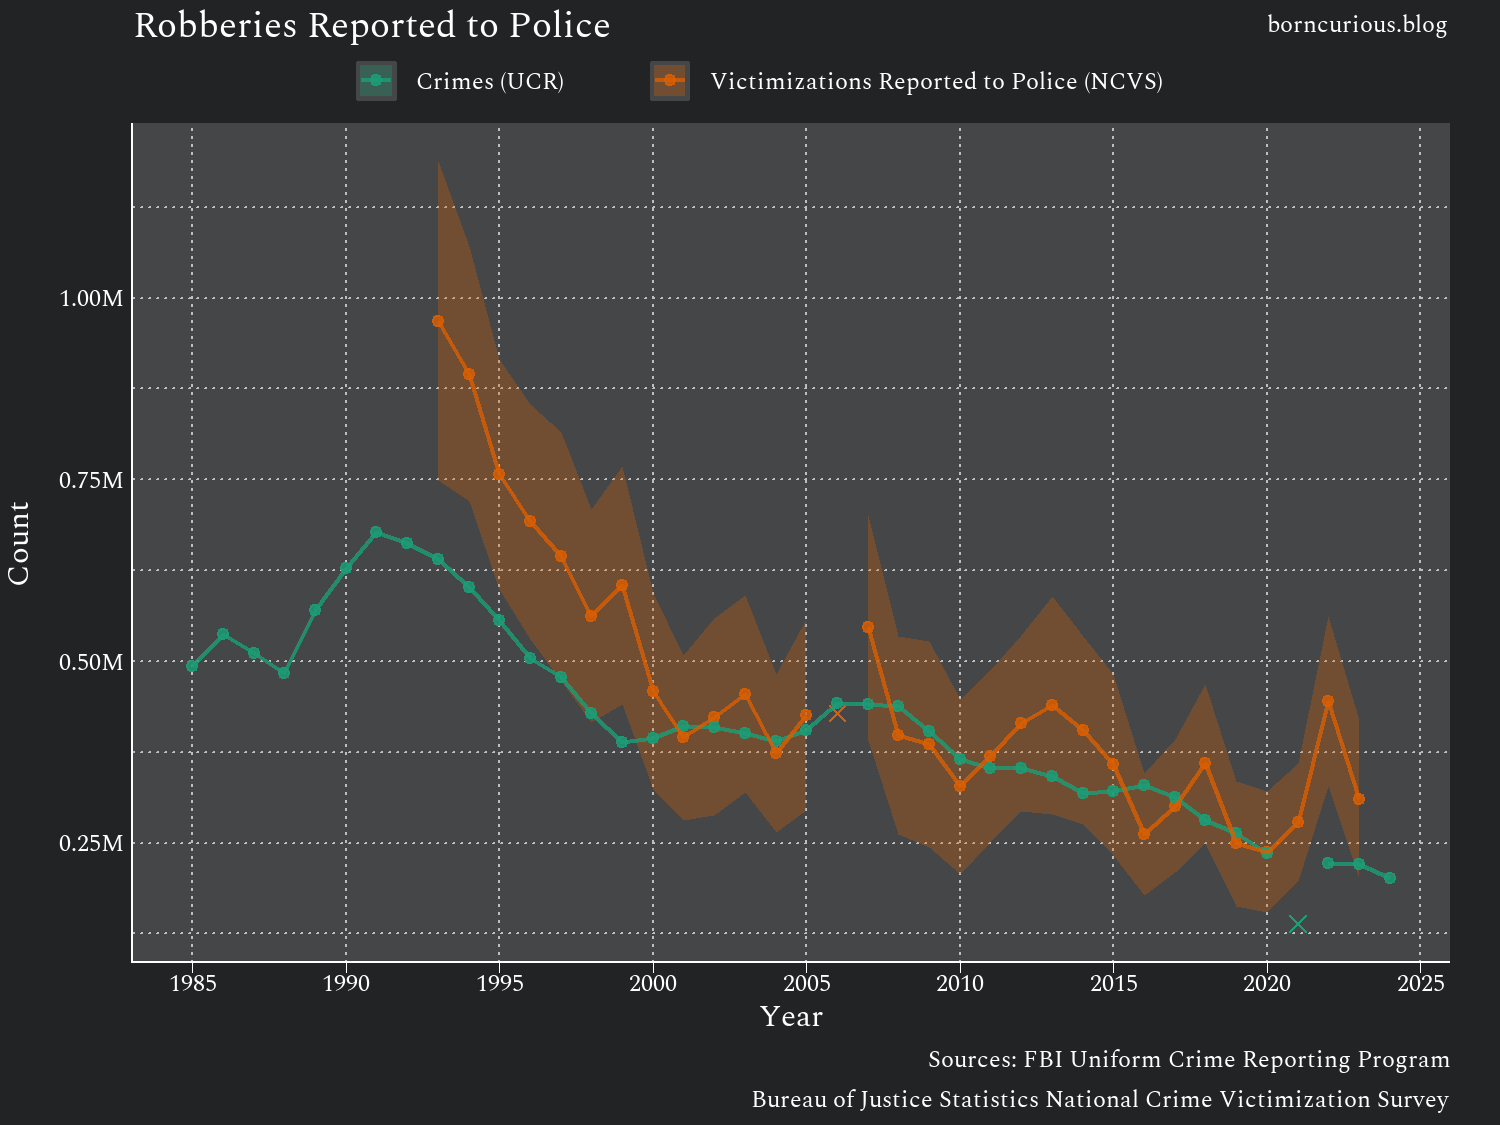
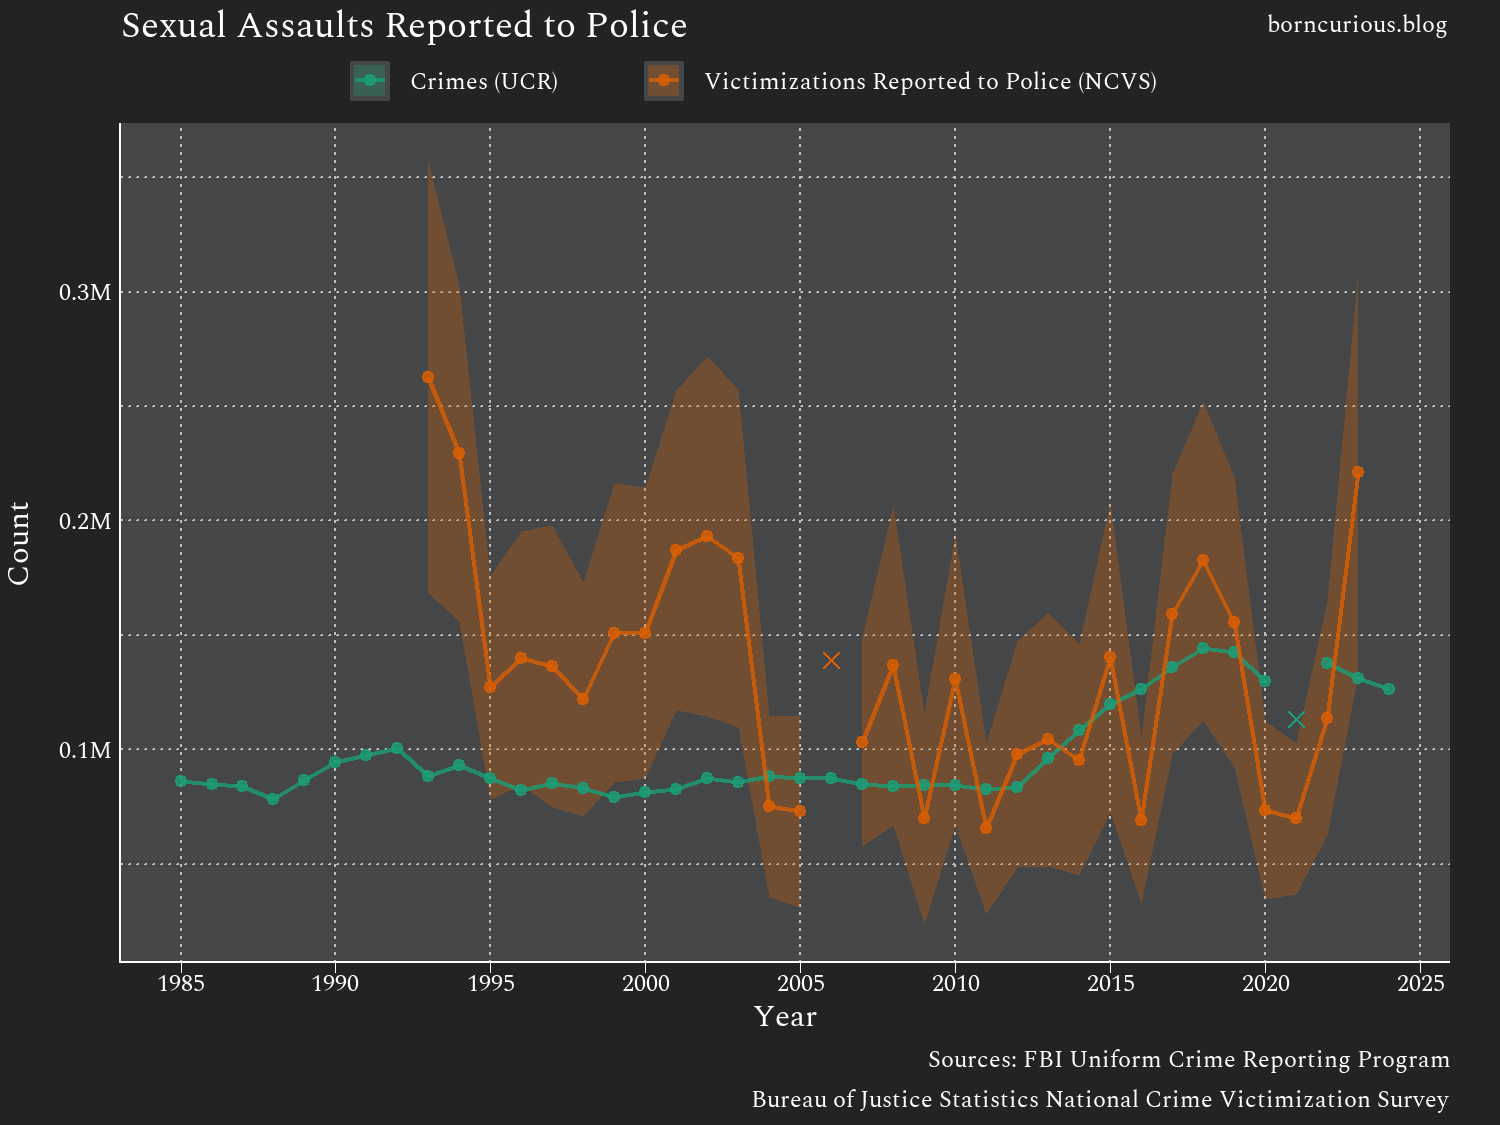
Figures 3 and 4 plot robberies and sexual assaults reported to the police from the NCVS against robberies and rapes reported in the UCR, respectively. As can be seen, the two estimates overlap in the 21st century.
The subtitle to Figure 2 is “excluding simple assault.” This is to make UCR and NCVS comparable, since the UCR does not include simple assault counts in its count of violent crimes.
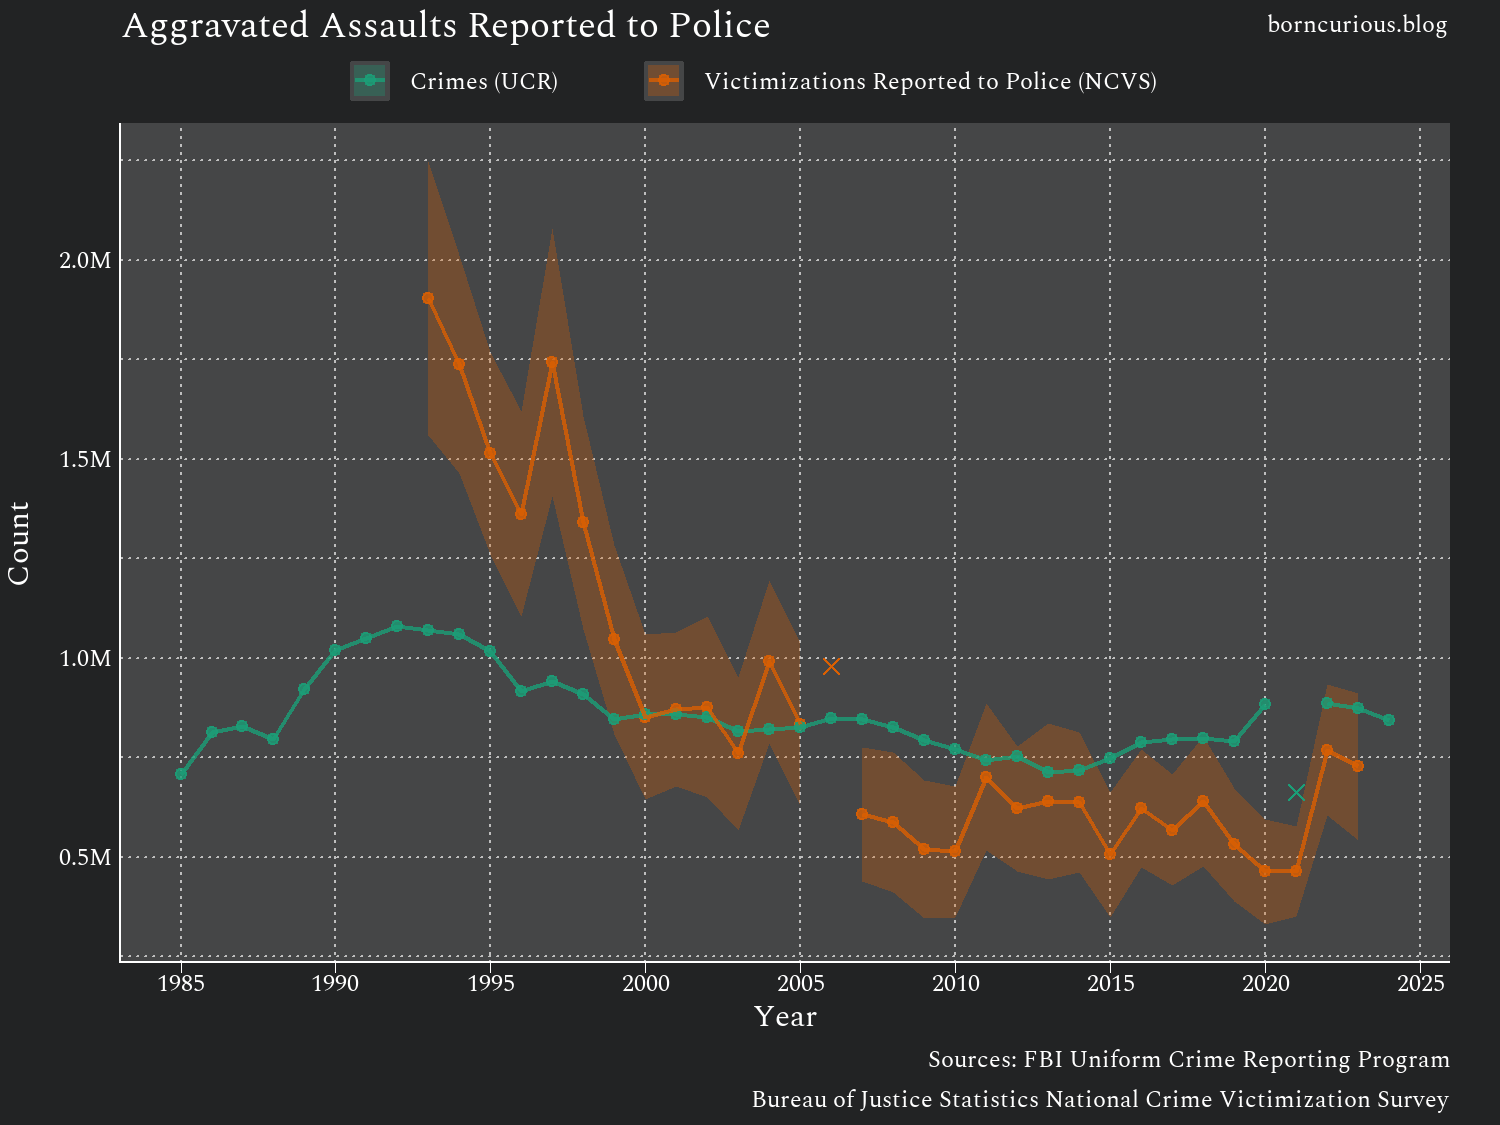
As we can see in Figure 5, aggravated assaults—unlike robberies or rapes—do appear to be subject to the phenomenon in which the victimizations reported to the police from the NCVS are lower than the UCR counts.
Many things can escalate a simple assault to an aggravated assault, e.g., use of a weapon, severity of injury, the assault occurring during the commission of another crime, whether the victim is a child, elderly, or a police officer, etc. Police know these legal distinctions better than most people do, so police are more likely to classify an assault as “aggravated” (in the UCR) than a victim describing the same incident to a survey interviewer (in the NCVS).
The D.C. Crime Statistics Controversy
Classification of crime is an issue not just for the comparison of violent crime as reported by the NCVS versus the UCR, but for an ongoing controversy about the accuracy of crime statistics in Washington, D.C., the national capital of the United States.
As previously mentioned, the agreement between the UCR and the NCVS in the 21st century does not imply that all jurisdictions in the United States are now accurately reporting all the violent crimes they are aware of. The NCVS estimates of violent crime can have a sampling error of about half a million crimes, which means there is wiggle room for individual jurisdictions to go unnoticed in a large country with 18,000 police agencies.
On July 18 of this year, local news broke a story that Michael Pulliam, a district commander for the Metropolitan Police Department (MPD) in Washington, D.C., had been suspended earlier in May. MPD leadership alleges that Pulliam manipulated crime statistics to make crime appear lower in his district.
This brought to public attention the tension that had been ongoing for years between MPD patrol officers and MPD and D.C. management.
The local Fraternal Order of Police alleged that this type of crime minimization—in which a supervisor arrives after a crime has occurred and downgrades the initial classification of the crime made by responding officers—is rampant throughout the MPD. It further alleges that Michael Pulliam is being made a scapegoat for the MPD’s misconduct, noting that he filed a complaint against an assistant chief just a week before he was suspended.
This has come at a bad time for Washington, D.C., as crime in the nation’s capital is under scrutiny due to the Trump Administration’s deployment of federal police and National Guard troops in Washington, D.C.
In August, the U.S. Congress and the Justice Department both launched investigations into the allegations of crime statistic minimization by MPD leadership.
A Washington Post article was published this past Sunday that summarizes the current state of allegations and investigations. Approximately three dozen MPD officers are voluntarily cooperating with the investigations, providing information about how supervisors routinely reclassify crimes.
The article noted that these allegations are not particularly new. When Lisa Burton, a former MPD officer, sued D.C. for alleged discrimination, the court case brought to the public the allegations that high-ranking officials were minimizing crime statistics to boost their careers.
The Scale of the Drop in Dispute
Despite these investigations, the nature of the dispute is nuanced.
No one seems adamant that crime in Washington, D.C., is increasing. Even Greggory Pemberton, the Chairman of the Fraternal Order of Police, has said, “Crime might have ticked down from 2023. But I certainly don’t think it’s down in the amounts that the department is claiming it is.”
This would be consistent with national trends. Both the UCR and the NCVS show a spike in violent crime in 2022 after the pandemic, followed by a gradual decrease in violent crime each year after that.
What makes Washington, D.C. particularly conspicuous is that authorities are claiming that violent crime is plummeting, with consecutive year-over-year decreases of 34% and 28%.
An Unfunded Answer
One potential improvement to this situation would be victimization survey data for Washington, D.C. (The NCVS is designed to provide estimates for the United States as a whole, rather than specific jurisdictions.) It turns out that Washington, D.C., passed a bill entitled the “Crime Victimization Survey Amendment Act of 2023,” which was ratified into law on April 4, 2024.
Unfortunately, the bill remains unfunded, and no victimization survey has taken place. This leaves Washington, D.C., without an independent mechanism to verify its crime statistics even as federal investigators probe whether those statistics have been manipulated.
Conclusion
Crime statistics in the United States have improved substantially over the past three decades. By 2000, the gap between crimes reported to police and crimes recorded in official statistics had essentially closed at the national level—a genuine achievement in government transparency and accountability.
However, we should remain skeptical of crime statistics. Most crimes are never reported to police in the first place. Official statistics can only reflect what victims choose to report and should always be analyzed in conjunction with victimization surveys.
Moreover, the incentives for authorities to minimize crime in their jurisdictions remain. The allegations currently under investigation in Washington, D.C.—where officers claim supervisors routinely downgrade crime classifications—remind us that even improved systems remain vulnerable to manipulation.
Crime statistics are better than ever, but that bar was remarkably low. We have made real progress, yet we remain far from having a complete picture of crime in America.
The NCVS also asks a single member from each household about victimizations of the whole household (e.g., burglary) to avoid duplicate counting.
The NCVS actually dates back to 1973, when it was known as the “National Crime Survey,” but the N-DASH only has data from 1993 onward. The UCR data goes back even farther, but the CDE only has data back to 1986.
I could produce estimates for NCVS data from 1973 to 1992, but it would require a significant amount of additional calculations on my part, and the readily available data are sufficient for the discussion in this article.
Some of this was police agencies failing to report the crimes to the UCR. They may have still processed the crimes with their own agencies.)