
The Sexual Revolution's Unintended Consequences
The unintended pregnancy rate surged in the wake of the sexual revolution.
The changes in sexual and reproductive culture during the 1960s and 1970s, popularly called "the sexual revolution," produced a measurable surge in the rate of unintended pregnancy that persisted well into the 1980s.
As I have written previously, much criticism of the sexual revolution rests on a false premise: that we live in a society with effective contraception. In reality, ours is a society that thinks it has effective contraception, but does not.
These two ideas are related. A society with genuinely effective contraception and the culture to use it consistently would not have experienced the surge that occurred from the 1970s into the 1980s.
A First Look at the Data
As in previous analyses, I used data from the National Survey of Family Growth (NSFG).
Totals vs. Rates
The naive approach would be to estimate the number of unintended pregnancies each year, as illustrated in Figure 1 below.
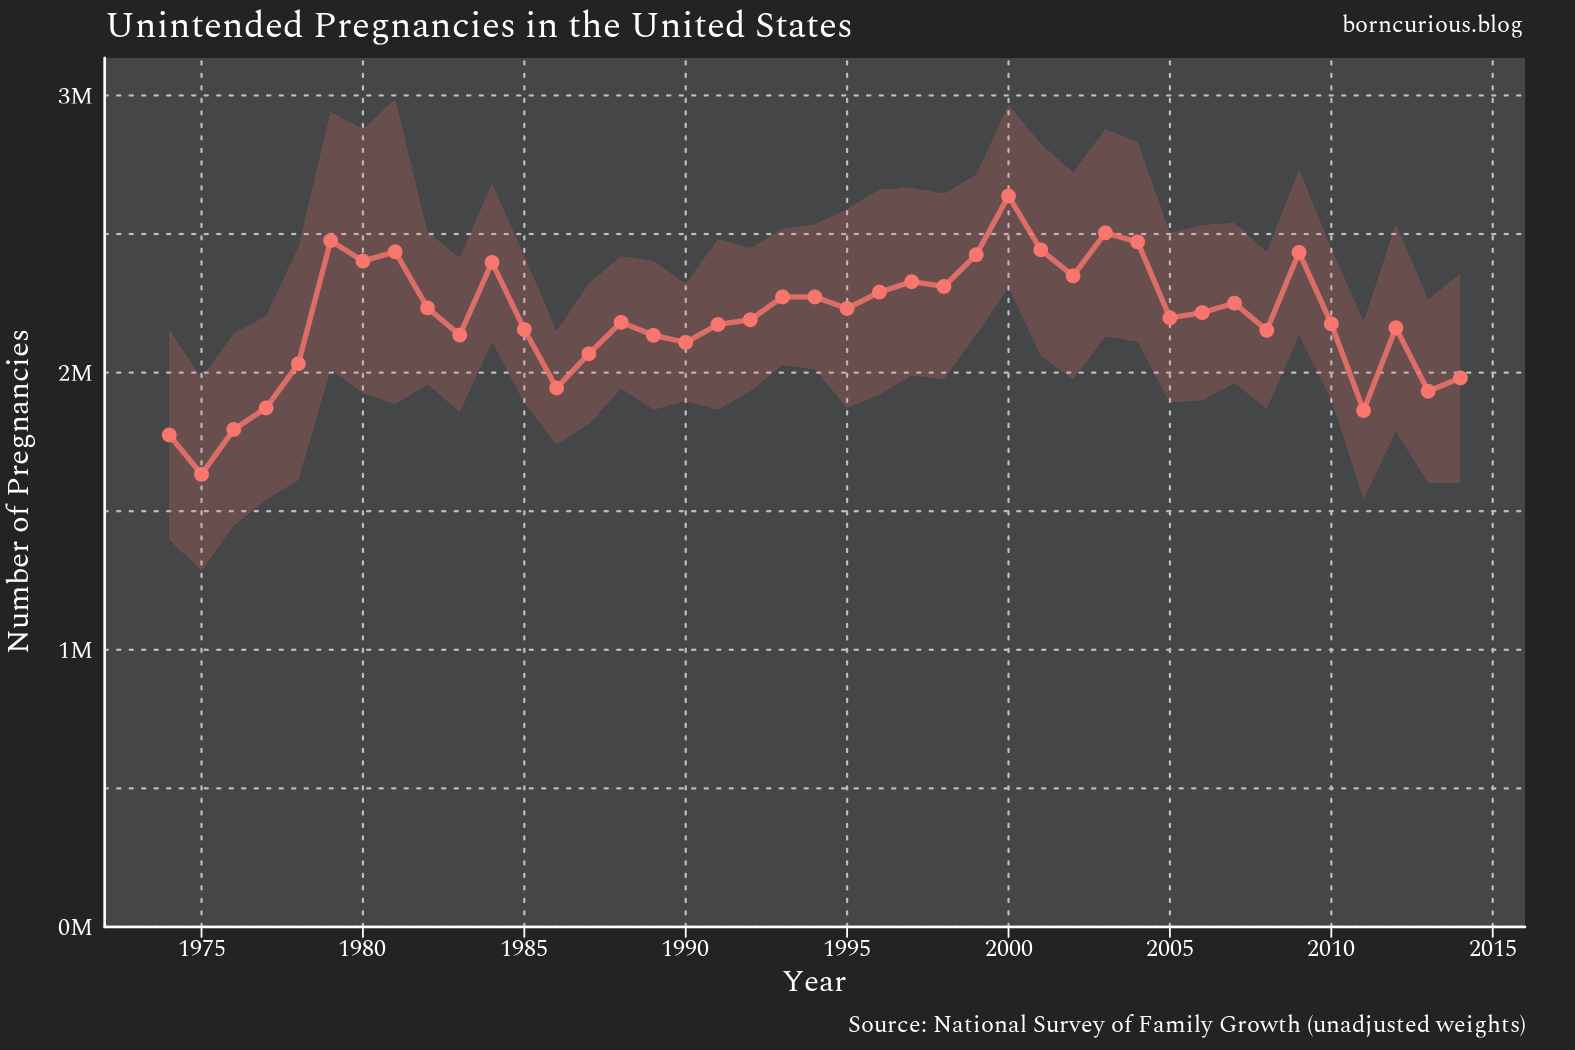
Even in the naive approach, we can see a spike in unintended pregnancies in the 1970s in the wake of the sexual revolution. However, this naive approach is incorrect for several reasons.
For one, the United States' population was increasing during this period. Figure 2 is an equivalent plot, but for intended pregnancies.
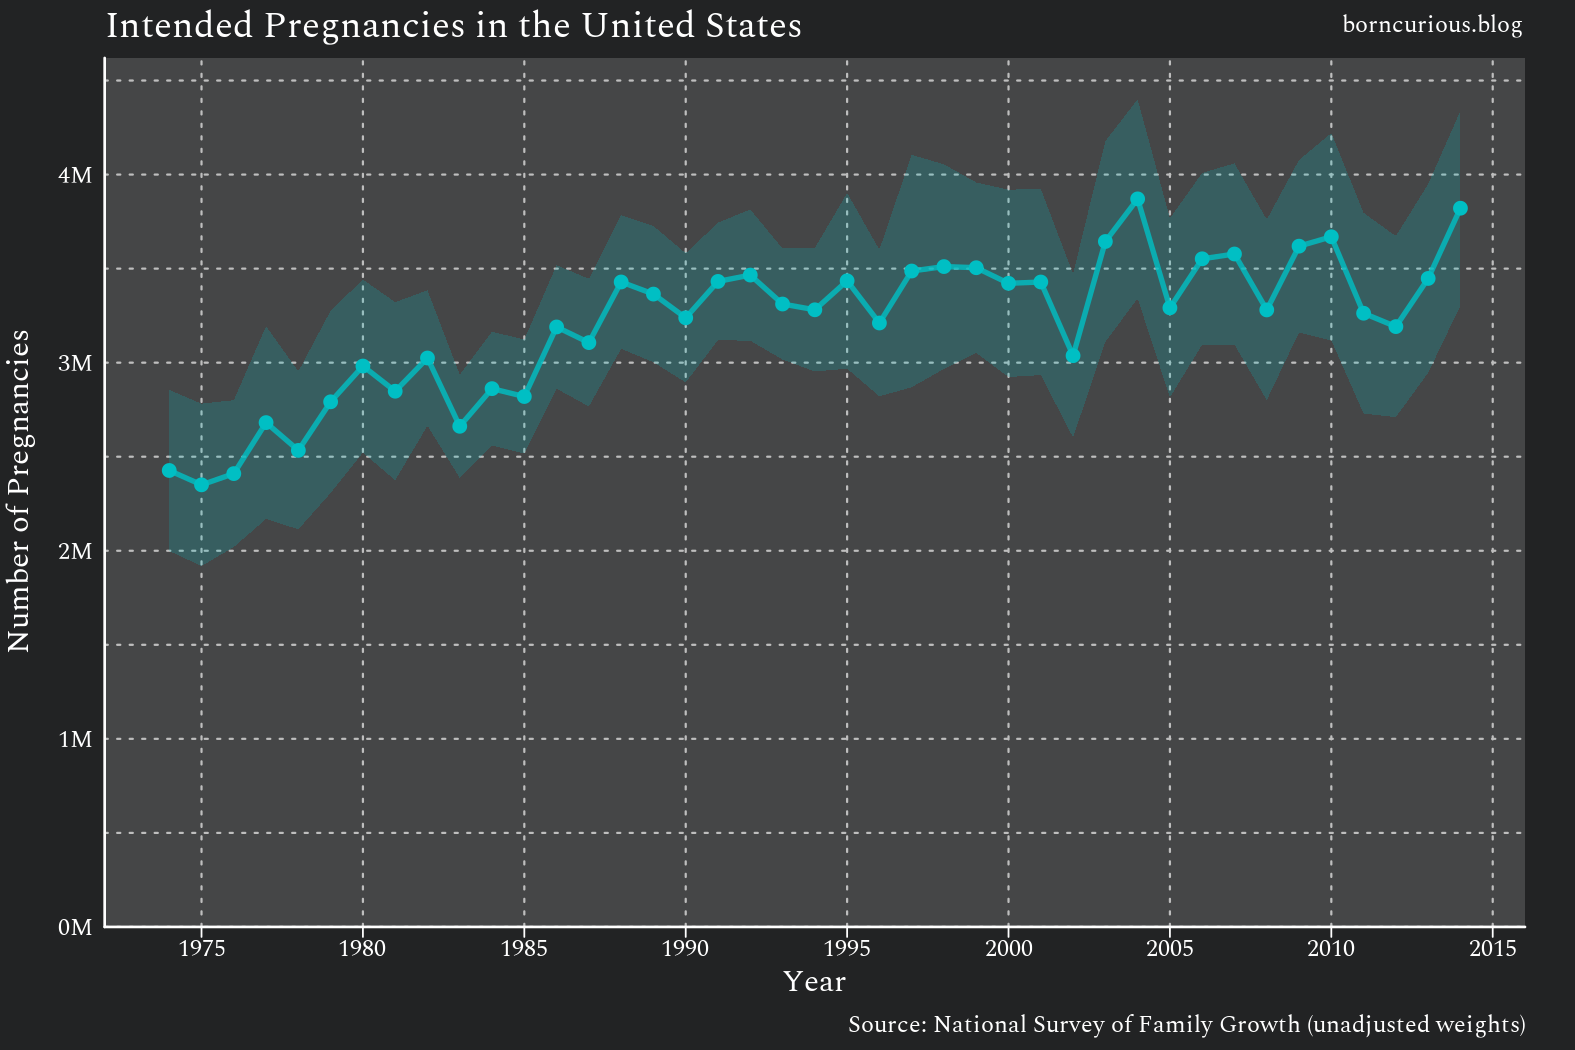
It appears in Figure 2 that intended pregnancies had an increasing trend for the last quarter of the 20th century. However, when we divide by the number of women of reproductive age1 in the United States in Figure 3, we see something else.
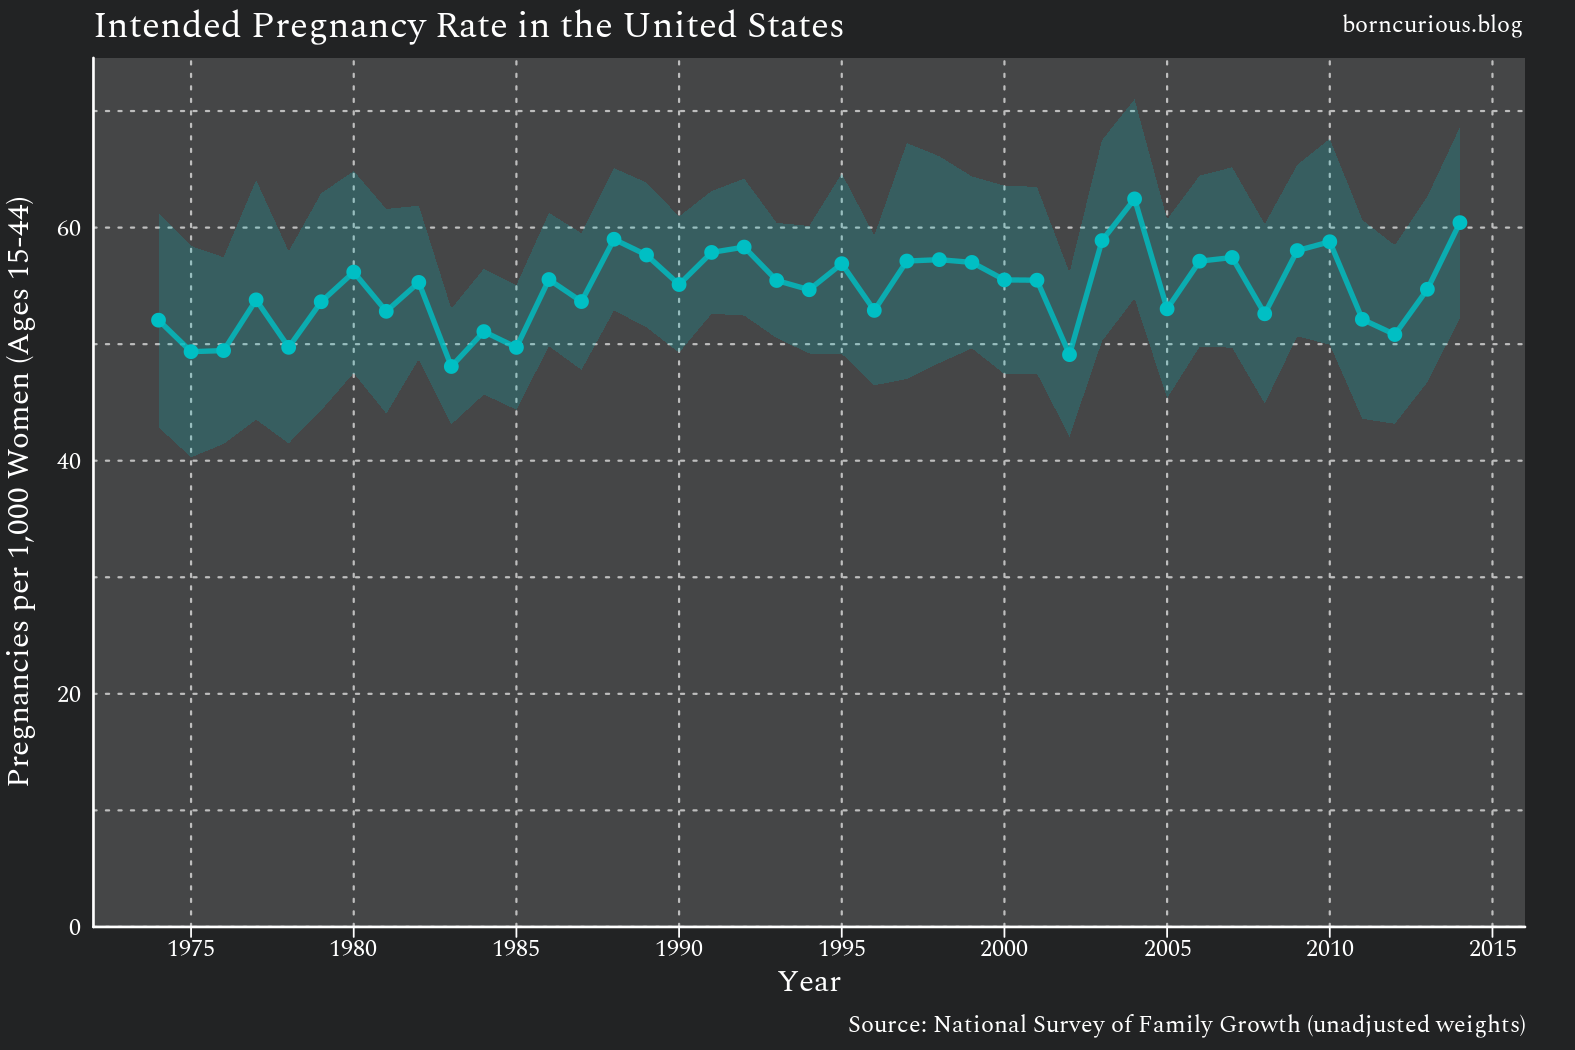
The increase in intended pregnancies can be explained almost entirely by population growth. In Figure 3, any increase is less than the sampling margin of error.
Thus, we are more interested in the rate of unintended pregnancies per woman of reproductive age than the total number of pregnancies.
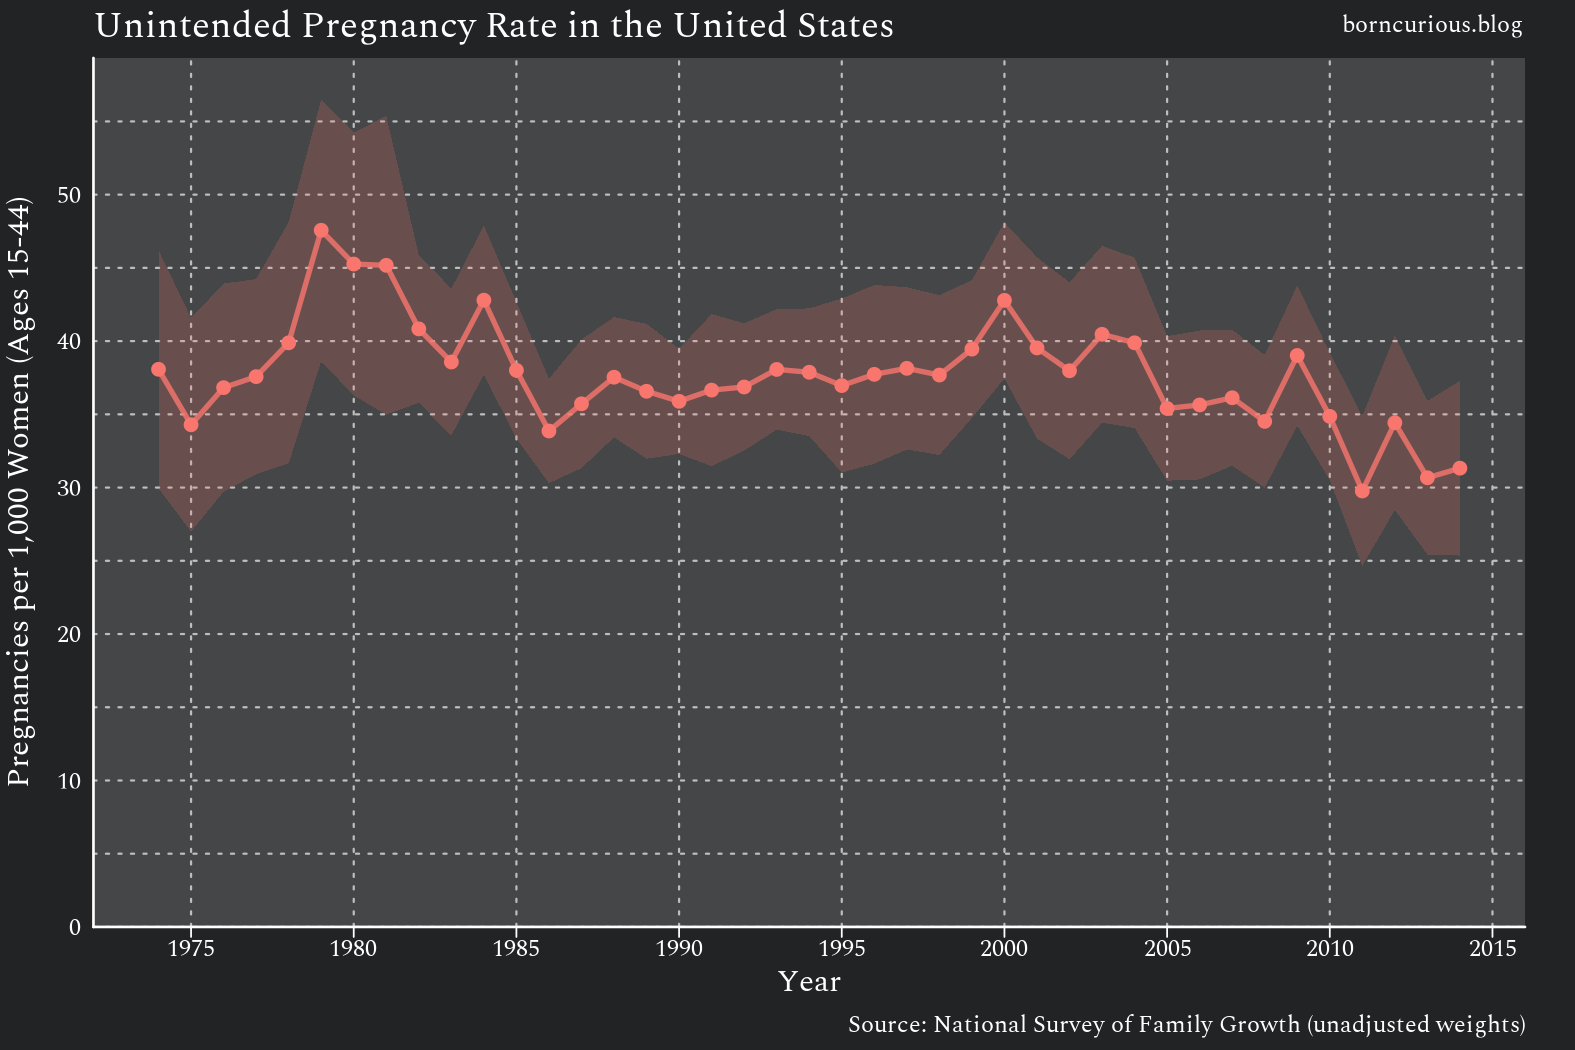
Figure 4 shows unintended pregnancies per 1,000 women of reproductive age per year. It still appears as though there was a spike in unintended pregnancies in the 1970s, followed by a decline in the 1980s back to a steady rate. However, this is also incorrect.
Abortion Under-reporting
An issue known to affect surveys such as the NSFG is the fact that fewer than half of pregnancies that ended in induced abortion are reported. This abortion under-reporting is so bad that the official NSFG documentation instructs us not to attempt to analyze abortion phenomena with the NSFG data.
Most pregnancies that end in induced abortion started as unintended pregnancies, so the bias in estimates due to abortion under-reporting is particularly bad for unintended pregnancies.
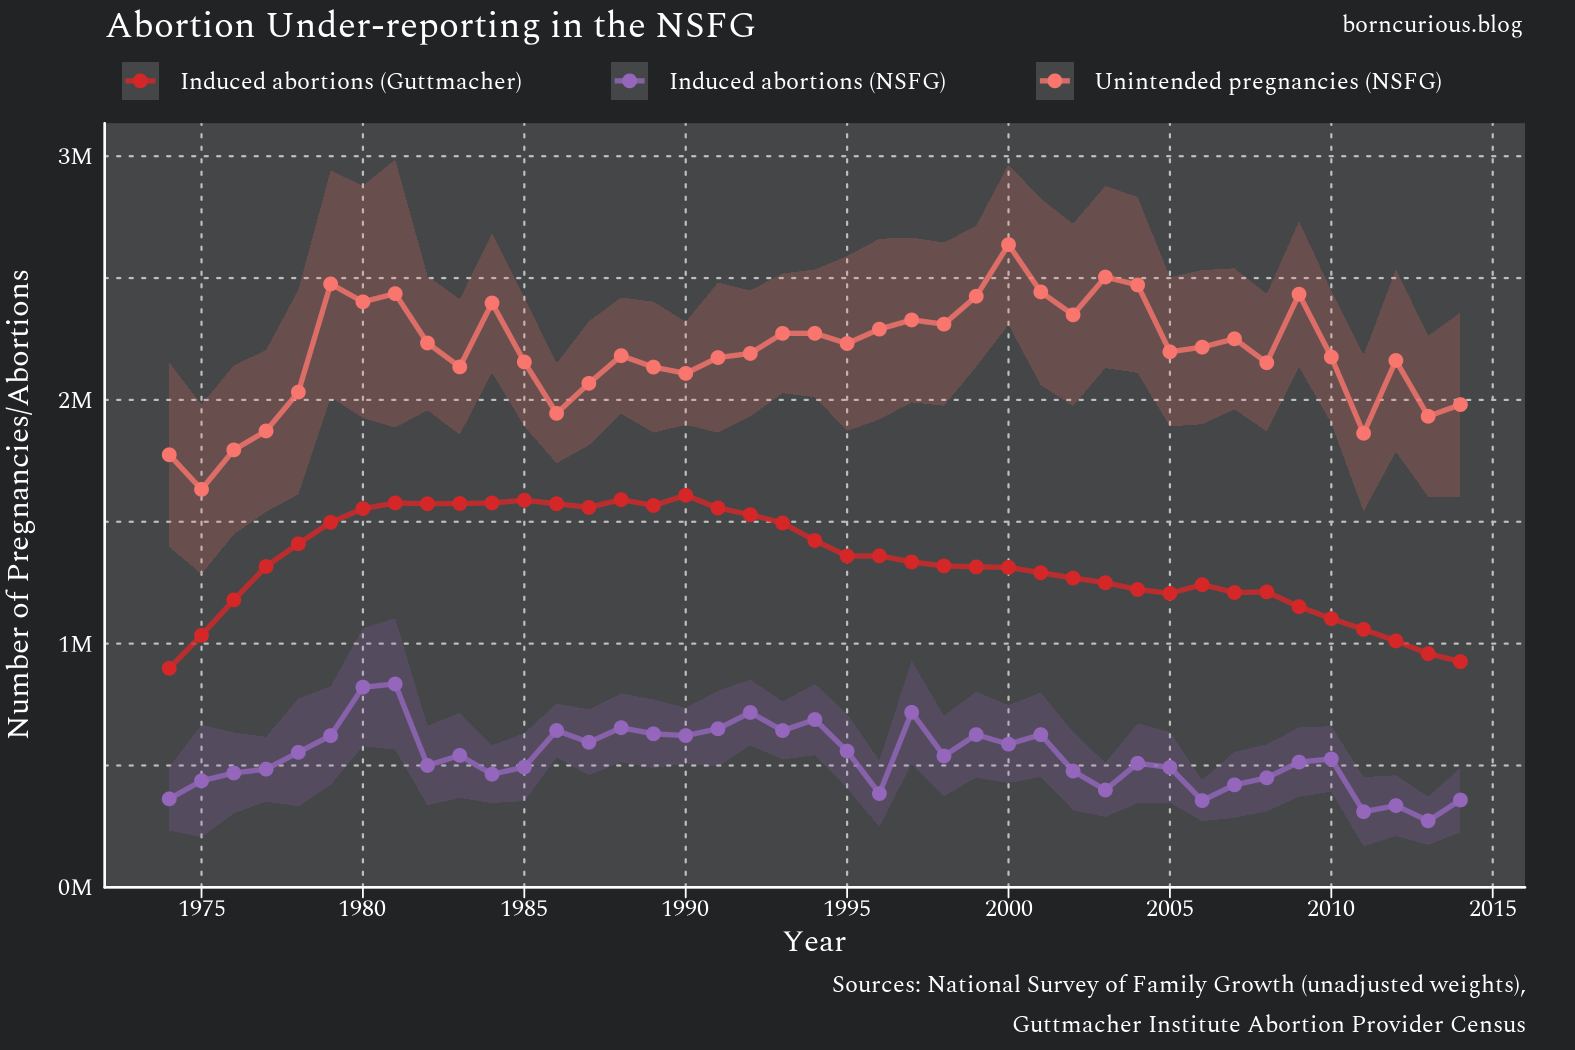
Figure 5 illustrates the effect of abortion under-reporting by comparing the NSFG’s estimates of the number of induced abortions per year with the number of induced abortions per year from an external source, namely, the Guttmacher Institute’s Abortion Provider Census (APC).
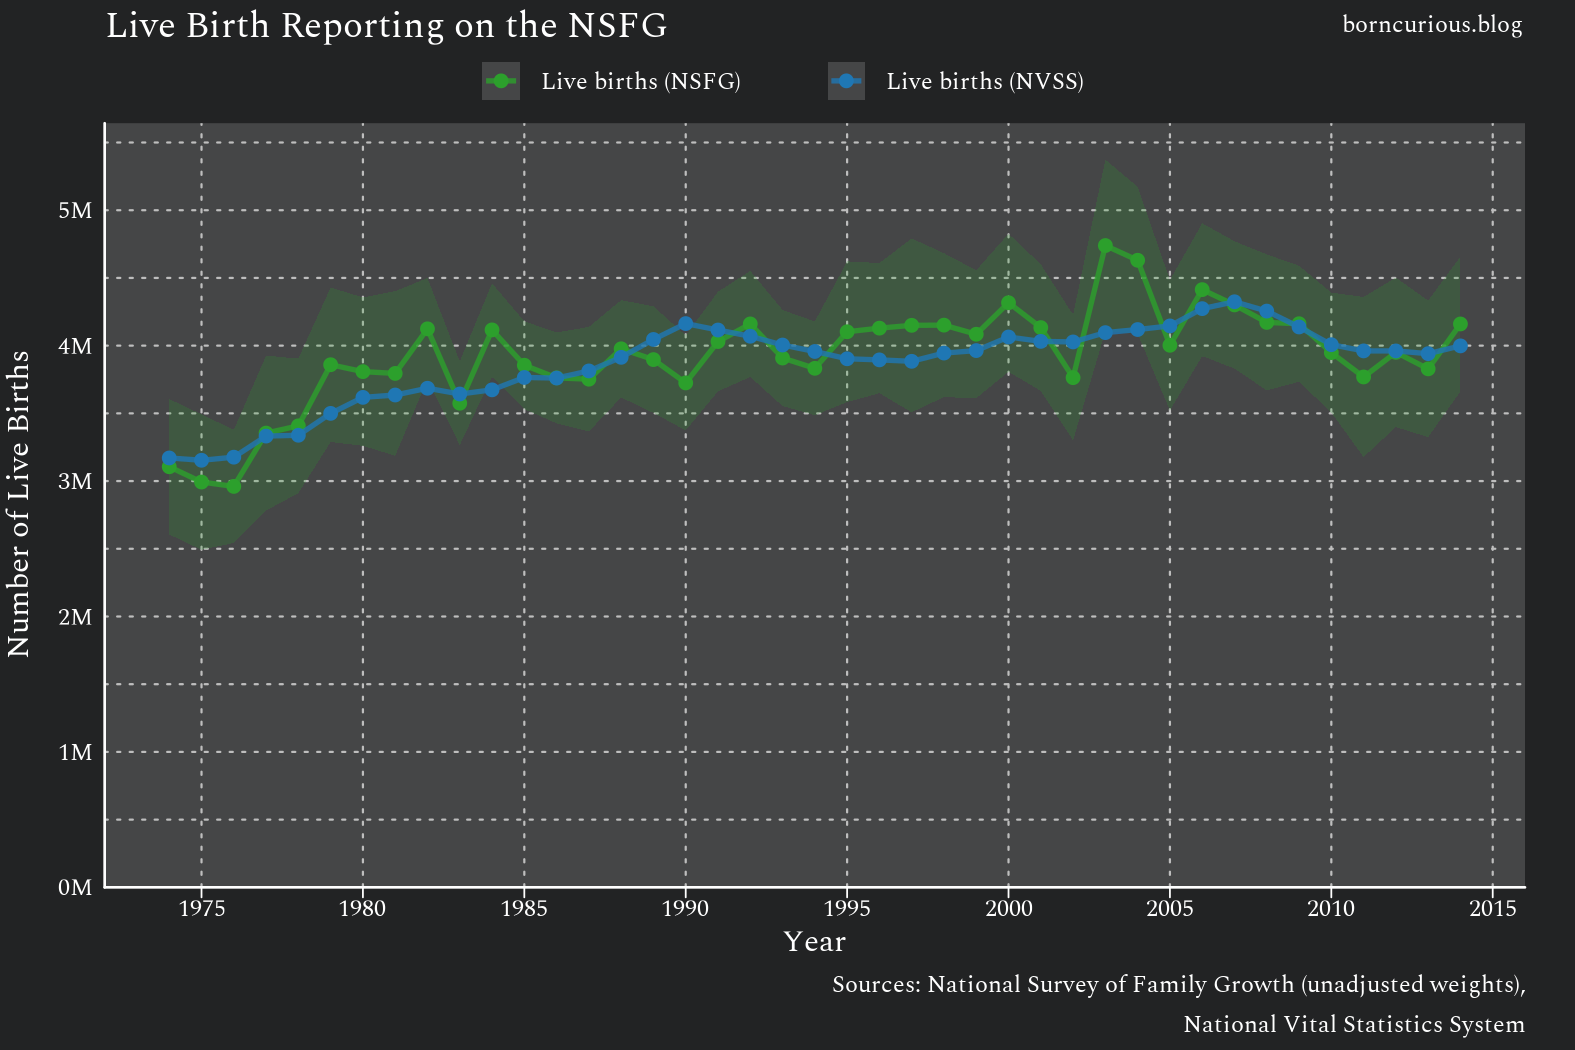
This is an issue just for induced abortions. Live births do not have this problem, as illustrated by Figure 6.
Adjusted Estimates and Their Implications
Fortunately, I have already addressed this by adjusting the NSFG’s weights to compensate for abortion under-reporting.
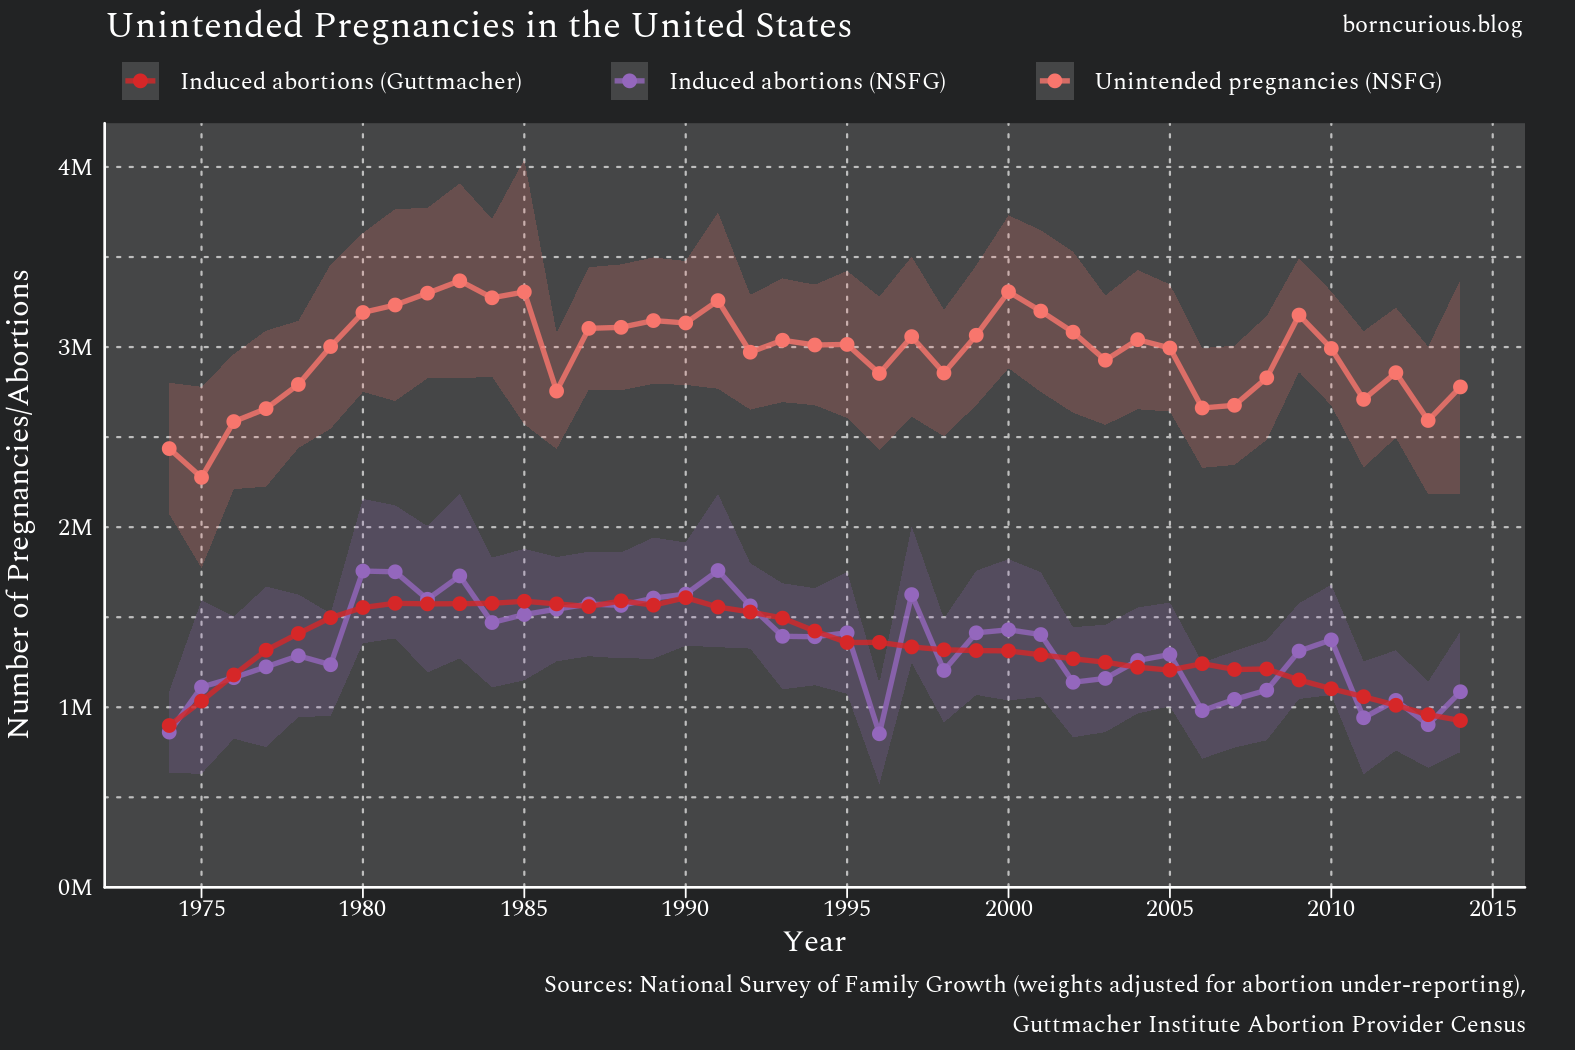
Figure 7 repeats the comparison from Figure 5, but now uses my adjusted weights. Note that estimates of the number of induced abortions per year from the NSFG now match the number of induced abortions per year from the APC.
This adjustment changes the estimates of unintended pregnancy, as illustrated in Figure 8.
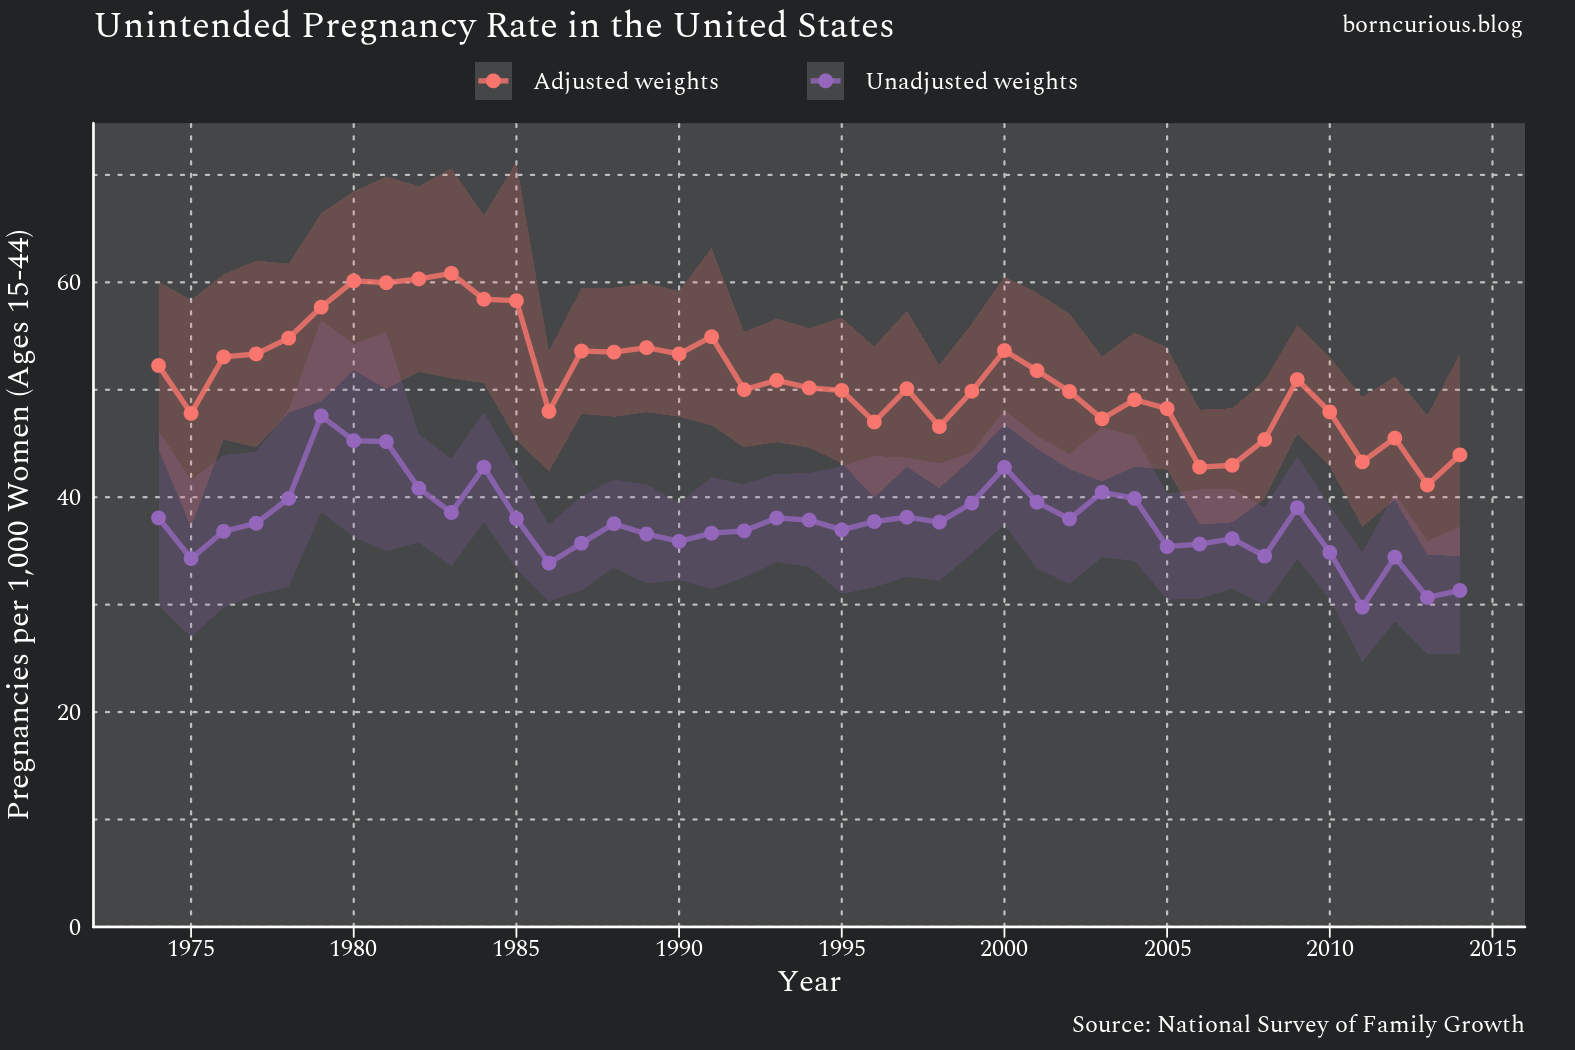
The unadjusted estimates peak at 47.6 (± 8.9) unintended pregnancies per 1,000 women of reproductive age per year in 1979. However, the adjusted — and more accurate — estimates peak at 60.8 (± 9.8) unintended pregnancies per 1,000 women in 1983. Indeed, the adjusted estimates of the unintended pregnancy rate are roughly 30-60% higher in the earlier cycles.
Also, the timing of the trend is different in the more accurate estimates. The rate of unintended pregnancy increases throughout the second half of the 1970s, crests in the 1980s, but remains high until about 1985, and then slowly starts to decrease with a few interruptions thereafter. (The discontinuity in 1986 is likely due to sampling variation.)
Because our estimates begin in 1974, which is late into the sexual revolution, we cannot estimate how much of an increase in the unintended pregnancy rate occurred during the sexual revolution. We can estimate something of a minimum, though.
The estimated 1975 rate is lower than the 1974 rate. Since we lack estimates before 1974, it is not clear which of these is more of a discontinuity, so let us be conservative and use the higher 1974 rate as a baseline.
Even using the higher baseline rate, there were approximately 2,730,000 excess unintended pregnancies between 1975 and 1985. This is the difference between the actual estimates of unintended pregnancies each year and the number that would have occurred if the rate stayed at the 1974 level.
This 2,730,000 figure is conservative. The unintended pregnancy rate may have been even lower in the 1960s. It may, of course, have been higher in the 1960s, as well. We do not know whether the 1970s trend of increasing unintended pregnancy rate started in the 1960s. But considering the unintended pregnancy rate was increasing rapidly in the 1970s and decreased to even lower rates in the 2010s than the lowest rates measured in the 20th century, it is not an unreasonable conjecture that the unintended pregnancy rate was lower in the 1960s than in the 1970s.
This raises the question of why our estimates begin in 1974. This is addressed in “Methodological Issues” below.
Regardless, the 2,730,000 figure is not intended to be a precise estimate but rather to give us an idea of the order of magnitude of the increase in the unintended pregnancy rate.
The sexual revolution likely led to additional unintended pregnancies in the multiple millions.
Further Analysis
Of course, this analysis is preliminary.
For one, it only implicates the sexual revolution in the rise in unintended pregnancies. The extent to which contraception in particular is implicated requires further analysis.
This is actually a surprisingly complicated question, but it would shed light on how much of the degradation of reproductive responsibility in the wake of the sexual revolution was contraception-driven.
This analysis also raises other questions.
Methodological Issues
Several methodological constraints shaped this analysis. The abortion under-reporting adjustment is described above; two additional issues deserve elaboration here.
Truncation Effect
Because of truncation, survey data are typically accurate only for pregnancies that occurred within a limited period before the survey. This truncation effect occurs because after any given amount of time, some percentage of women who had pregnancies will age out of the target population, die, emigrate, or otherwise leave the survey population.
For instance, a survey done in 1990 will miss any pregnancies from 1970 among women who died between 1970 and 1990, since they are no longer around to report on their pregnancies.
I have found that pregnancy estimates are accurate for about 5 to 10 years before a survey, due to the truncation effect.
The NSFG, administered by the National Center for Health Statistics, is considered the premier source of population-level data on pregnancy intent and outcomes in the United States. Its first cycle ran in 1973. Before then, there were other surveys, such as the National Fertility Survey (NFS) administered by Princeton’s Office of Population Research.
You would think, then, that we would have estimates going back to about 1963.
Unfortunately, these earlier surveys (including the first two cycles of the NSFG) surveyed only married women,2 reflecting the sexual mores of their day. Needless to say, unintended pregnancy is a phenomenon that is experienced by unmarried women, as well. Therefore, these earlier surveys are biased — in the statistical sense — rendering them useless for estimates of unintended pregnancies.
The first cycle of the NSFG to survey all women, regardless of marital status, was Cycle 3, conducted in 1982, giving a range for first estimates of 1972-1977.
My analysis begins in 1974 because that is when the Guttmacher Institute first began reporting APC counts, which are needed for the weight adjustment.
Pregnancy Intent
Another major issue is that the concept of pregnancy intent is itself an oversimplification, though one that is still a useful abstraction.
For most of human existence, for most of the population, pregnancies were just something that happened in life, and people dealt with them. The idea of consciously planning a pregnancy has historically been relevant for a relatively privileged minority. It has become a concept for the general population only in the mid-20th century. (Campbell & Mosher, 2000)
Furthermore, pregnancy intent is complicated to measure cleanly. For instance, it is surprisingly common for people to be using contraception and yet not classify the resulting pregnancy as unintended. Indeed, many such women report being happy about the pregnancy. (Trussell et al., 1999)
Because of this complexity, Barrett et al. (2004) suggest using multiple dimensions and treating pregnancy intent more as a spectrum, rather than a binary intended vs. unintended classification.
I agree with this approach, and I even tried a limited version of it in this analysis. Unfortunately, the data just are not there, especially in the earlier cycles of the NSFG, and because this is a trend analysis, I needed to harmonize the data across all cycles of the NSFG I used. This harmonization required me to take the lowest common denominator across all cycles.
What I was left with was just the classification of the NSFG encoded in the WANTWIFE and OLDWANTR variables. These encode answers to questions such as
Right before you became pregnant, did you yourself want to have a(nother) baby at any time in the future?
and
So would you say you became pregnant too soon, at about the right time, or later than you wanted?
If the respondent indicates she did not want to have the pregnancy at any time in the future, the pregnancy gets classified as unwanted. If the respondent answers that she became pregnant too soon, the pregnancy gets classified as mistimed.
In my scheme, I classified any unwanted or mistimed pregnancies as unintended.
Bibliography
Barrett, G., Smith, S. C., & Wellings, K. (2004). Conceptualisation, development, and evaluation of a measure of unplanned pregnancy. Journal of Epidemiology & Community Health, 58(5), 426–433.
Campbell, A. A., & Mosher, W. D. (2000). A History of the Measurement of Unintended Pregnancies and Births. Maternal and Child Health Journal, 4(3), 163–169. https://doi.org/10.1023/A:1009519329226
Trussell, J., Vaughan, B., & Stanford, J. (1999). Are all contraceptive failures unintended pregnancies? Evidence from the 1995 National Survey of Family Growth. Family Planning Perspectives, 31(5), 246–247, 260.
In the NSFG before 2015, “women of reproductive age” meant all women in the United States aged 15 to 39. After 2015, this was expanded to include women aged 15 to 44 years. I used women aged 15 to 44 throughout, which technically yields biased estimates for earlier NSFG iterations, but the number of pregnancies in women aged 39 and older is small and within the margin of error, anyway.
More accurately, they only surveyed women who had ever been married.