
Fact Round-up: Trends in the Unintended Pregnancy Rate in the United States, 1974-2015
Key findings from first five-part series
This is a fact round-up, a summary of the major results from previous analyses. For further exploration of the results and discussion of the methodological issues encountered in obtaining them, see the links to the previous articles.
Unintended Pregnancy Rate
We have data starting in 1974 on unintended pregnancy in the United States. There have been two major trends since then: a surge in the rate of unintended pregnancy in the 1970s, followed by a gradual decline from the mid-1980s on.
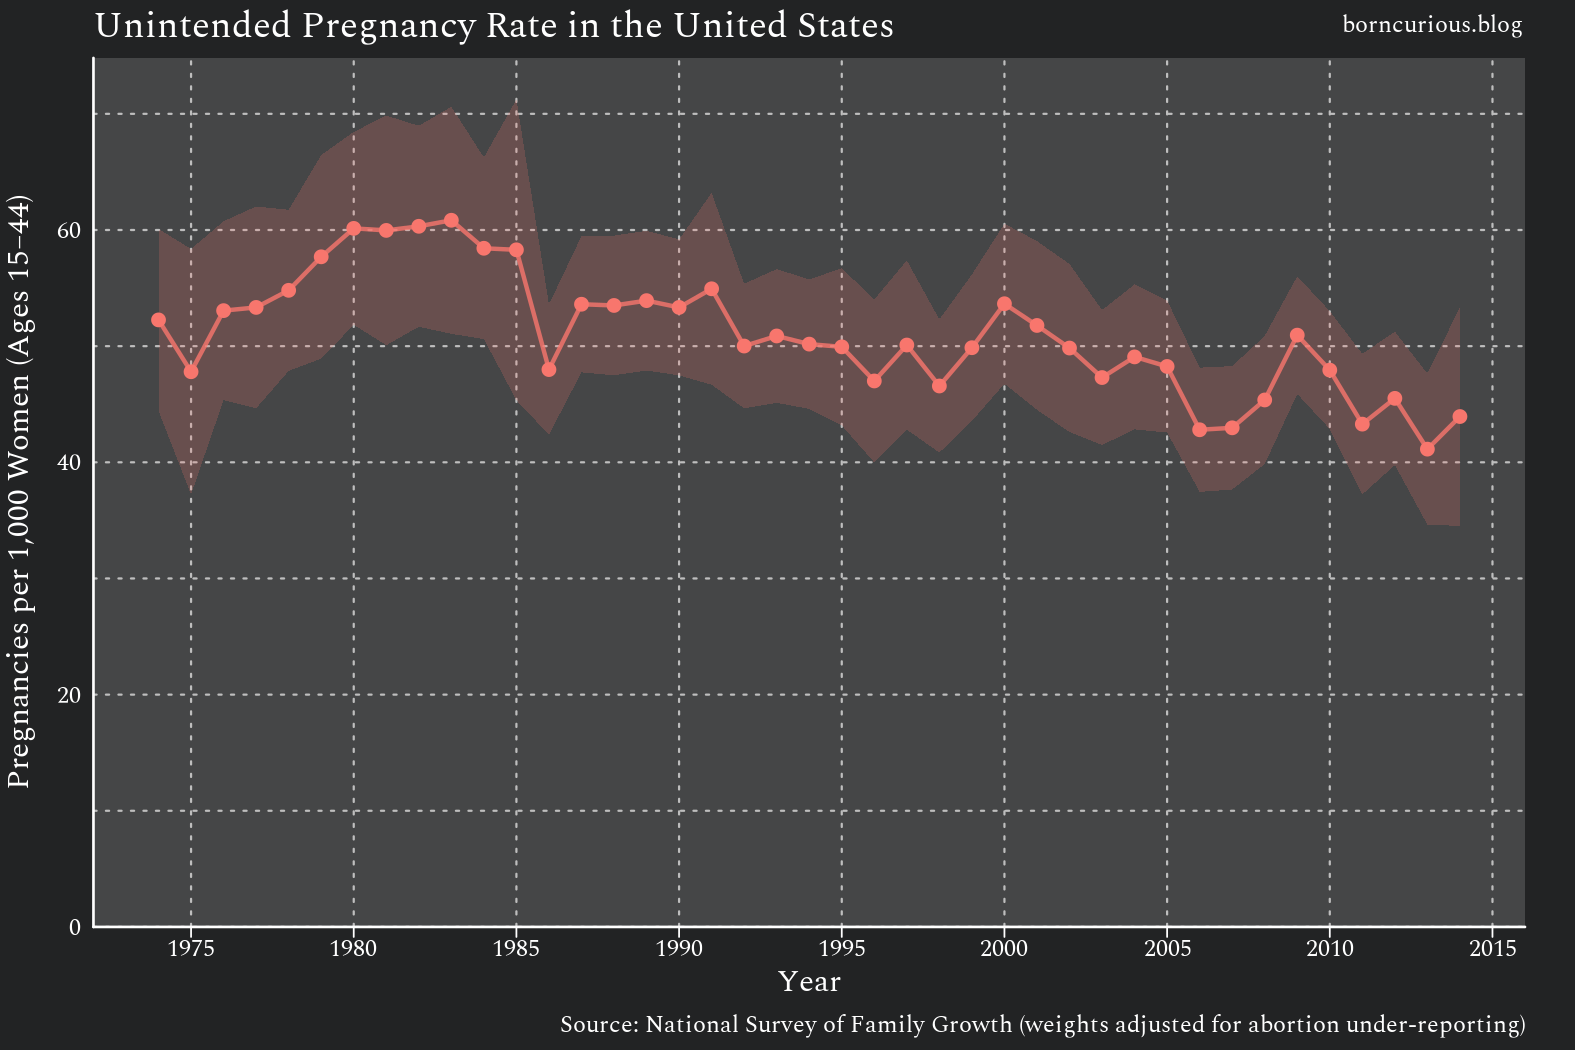
In 1974, there were 52 (±8) unintended pregnancies per 1,000 women of reproductive age (ages 15-44) per year. The rate climbed in the 1970s and peaked in 1983 at 61 (±10) pregnancies per 1,000 women. The rate then declined more gradually. By 1992, it had returned to early 1970s levels of 50 (±5) pregnancies per 1,000 women. In 2013, it reached a low of 41 (±7) pregnancies per 1,000 women.
Further Reading: “The Sexual Revolution’s Unintended Consequences”
Total Unintended Pregnancies
Throughout this time period, the number of women of reproductive age in the United States has been increasing.
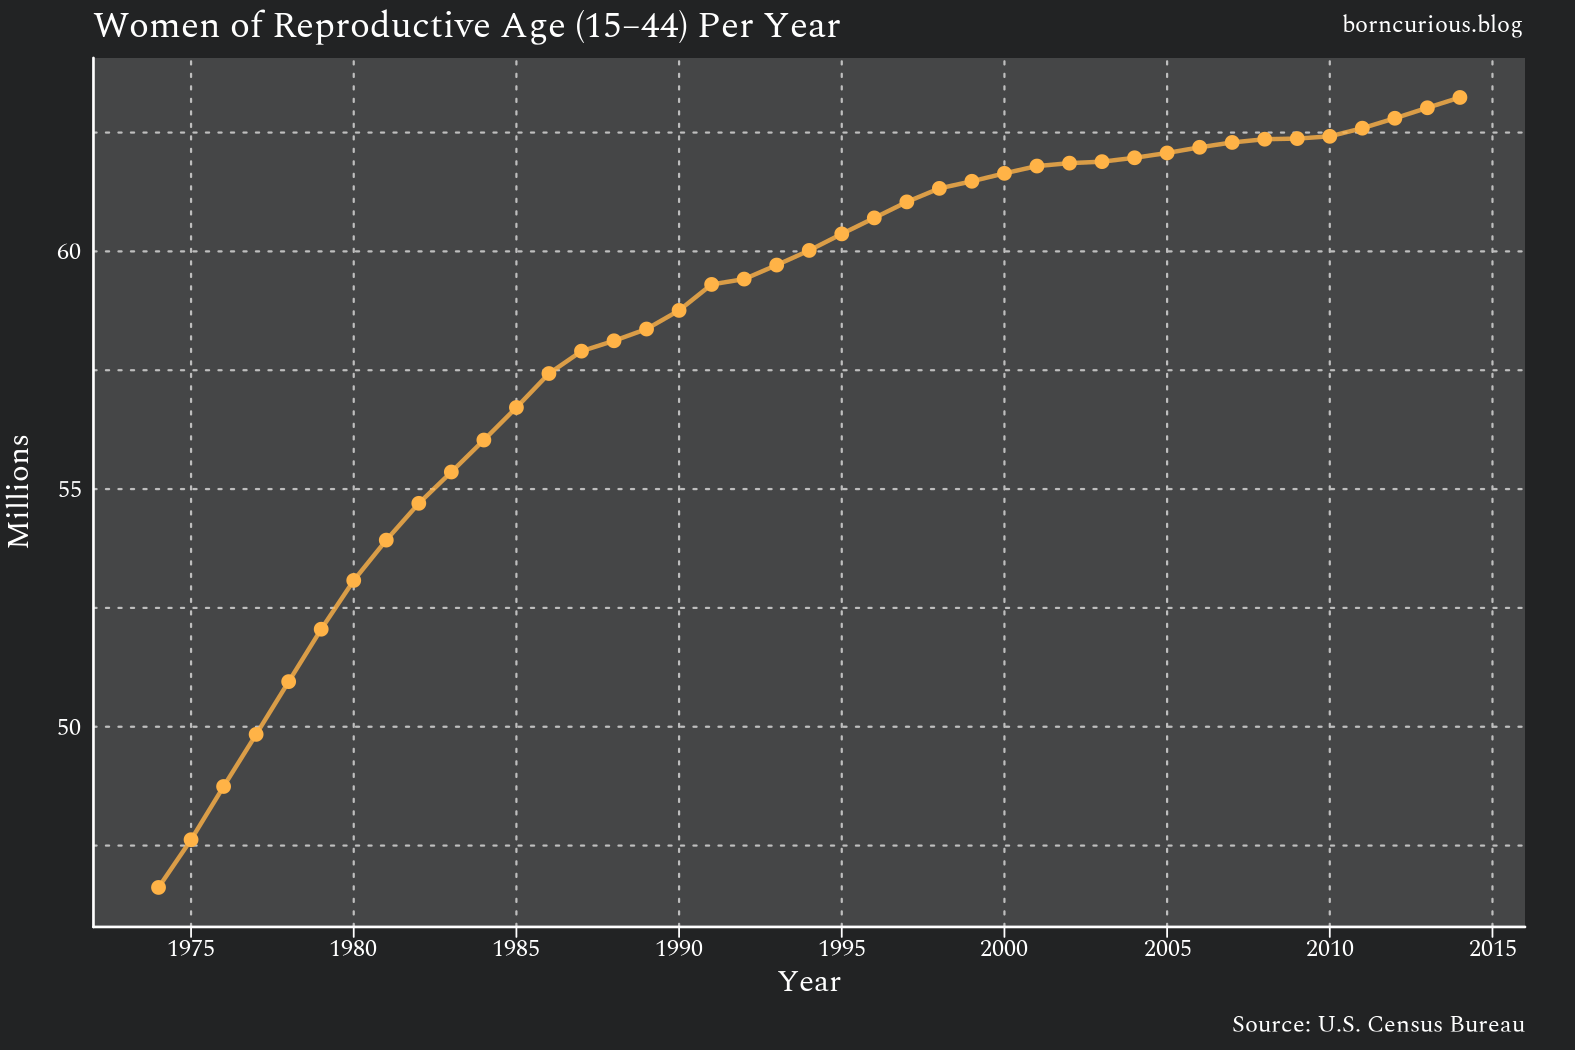
In 1974, there were about 46.6 million women of reproductive age in the United States. At the peak of the unintended pregnancy rate in 1983, there were about 55.4 million. At the low of the unintended pregnancy rate in 2013, there were about 63 million.
Because of the increasing population, the trend in total unintended pregnancies shows a smaller decline.
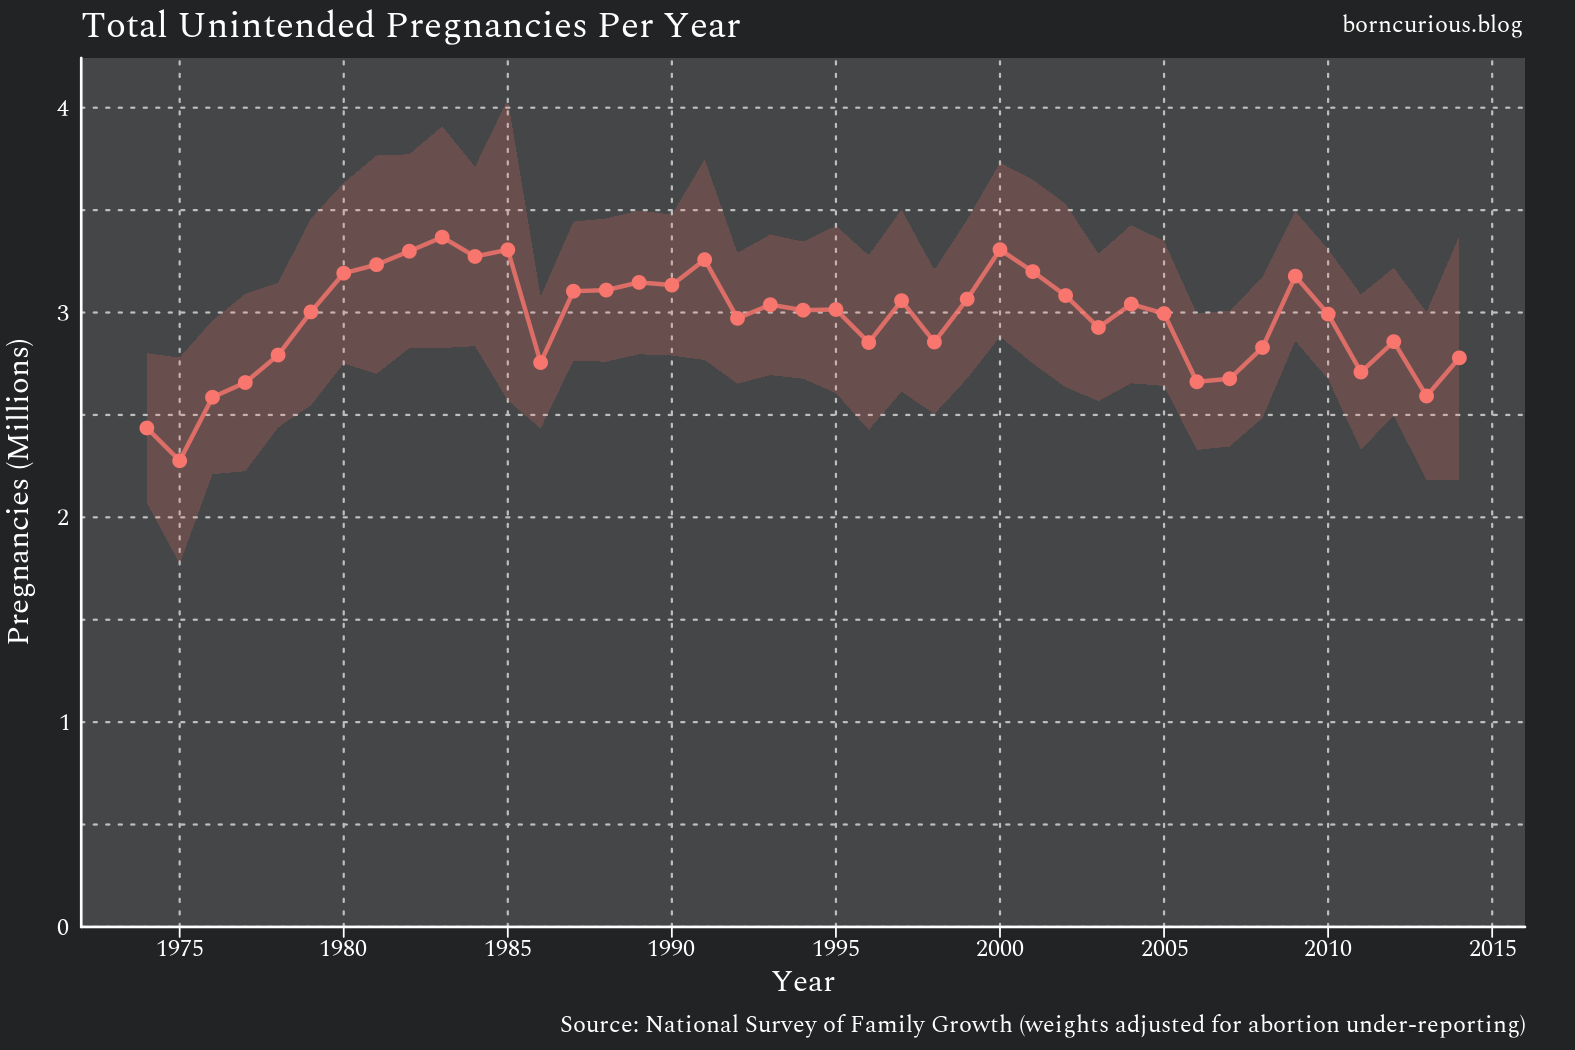
There were 2,440,000 (±360,000) unintended pregnancies in the United States in 1974. In 1983, at the peak of the unintended pregnancy rate, there were 3,370,000 (±540,000) unintended pregnancies. Even though the rate had returned to early 1970s levels by 1992, there were 2,970,000 (±320,000) unintended pregnancies due to a larger population size. In 2013, with the lowest recorded unintended pregnancy rate, there were still 2,590,000 (±410,000) unintended pregnancies.
Further Reading: “The Sexual Revolution’s Unintended Consequences”
Decomposition by Age
During the surge in the 1970s, unintended pregnancy rates increased across almost all age groups.
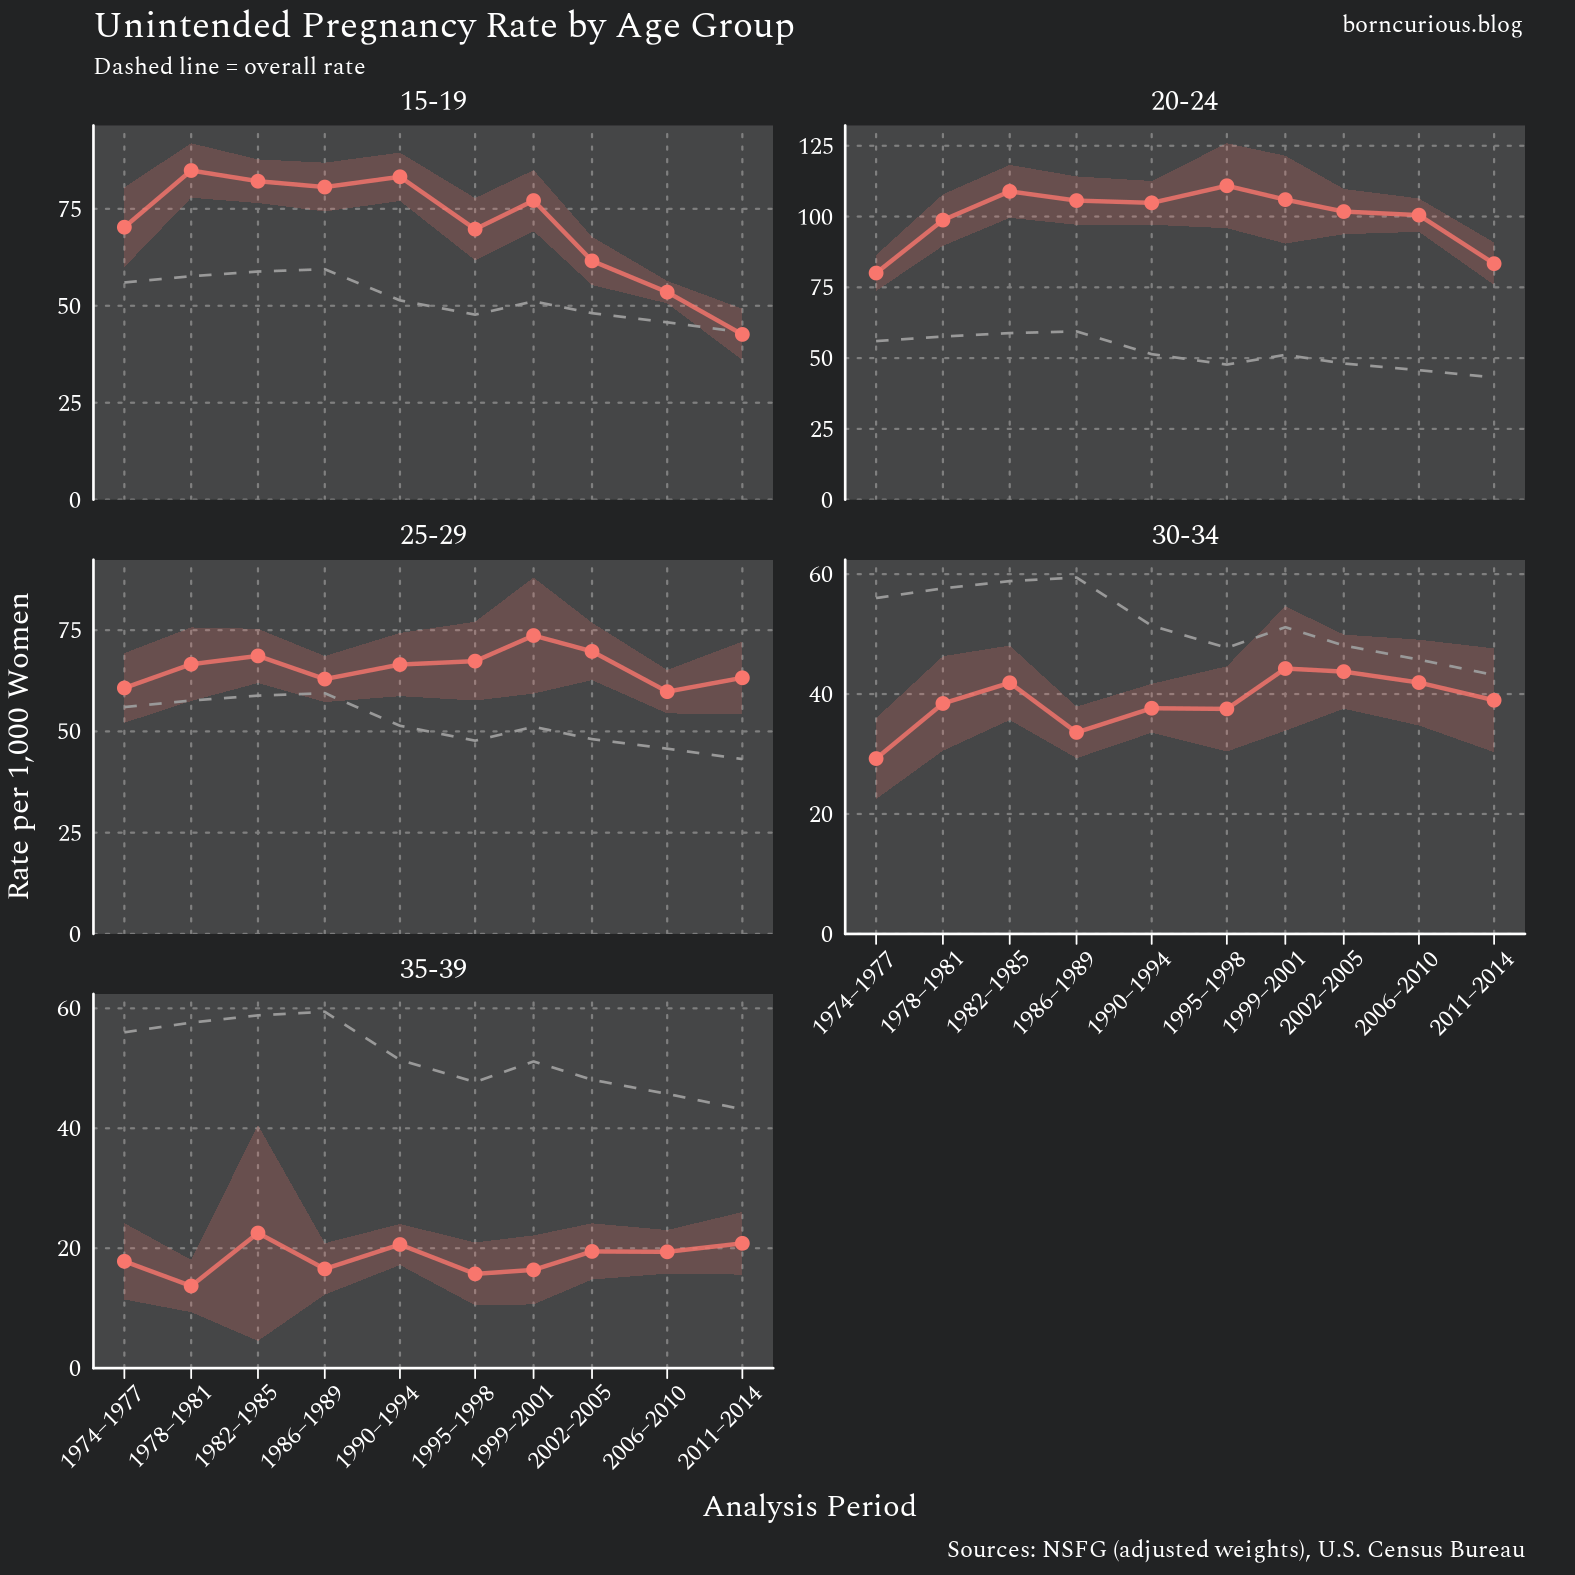
The decline in the unintended pregnancy rate after the 1980s was concentrated in the 15-19 age group, which had its rate cut in half. There were 85 (±7) unintended pregnancies per 1,000 girls per year in 1978-1981, and only 43 (±7) unintended pregnancies per 1,000 girls per year in 2011-2014.
In contrast, the 20-24 age group did not fully recover from the 1970s surge until 2011-2014, and the 30-34 age group never fully returned to 1970s levels.
Because of the decline in teen pregnancy, the 15-19 age group went from the second-highest rate of unintended pregnancy in 1974 to the third-highest sometime between 1999 and 2005.
For women 20 years or older, the unintended pregnancy rate is highest in the youngest age groups and decreases in older age groups.
Further Reading: “Age and Unintended Pregnancy”
Birth Control Use during the Surge
The surge in the unintended pregnancy rate that occurred in the 1970s occurred entirely among women using a method of birth control. The unintended pregnancy rate among women not using a contraceptive method remained the same.
(However, the unintended pregnancy rate was higher in 1974-1977 among non-users of contraception than among birth control users, and it remained higher even after the increase in the unintended pregnancy rate among women using contraception.)
Combined oral contraceptive pills were the most commonly used method among women experiencing unintended pregnancy during the surge.
Further Reading: “Birth Control’s Failure”
Thanks for this summary. Do you think the relative decline in the unintended pregnancy rate during the 1980's was due to HIV awareness encouraging condom use?