
Age and Unintended Pregnancy
Risk gradients, the teen exception, and why the 1970s surge was no illusion
When it comes to reproductive outcomes, age is a very strong covariate. Just a few years of age difference can lead to large effect sizes.
Indeed, I alluded to this when I first started an investigation into trends in unintended pregnancy, writing,
As with all things reproductive, these results are heavily age-covariated. What age groups and birth cohorts are experiencing these trends in the unintended pregnancy rate?
What age groups are most at risk for unintended pregnancy? Has this changed over time?
Furthermore, it is possible that the surge in the rate of unintended pregnancy per capita in the 1970s is an illusion. It could be an artifact of age composition effects. Sometimes demographic changes within a population create the illusion of a trend that disappears when analysis is broken down by age.
This age composition hypothesis is plausible. The 1970s followed the Baby Boom. As the Baby Boom generation has moved through various age groups, they have dramatically changed the age distribution in the United States.
Could the supposed surge in the unintended pregnancy rate be an illusion created by there being more women in the age groups with the highest risk for unintended pregnancy?
What Age Groups Are Most at Risk?
Figure 1 depicts trends in the rate of unintended pregnancy per woman per year in the United States from 1974 to 2014, broken down by age group.
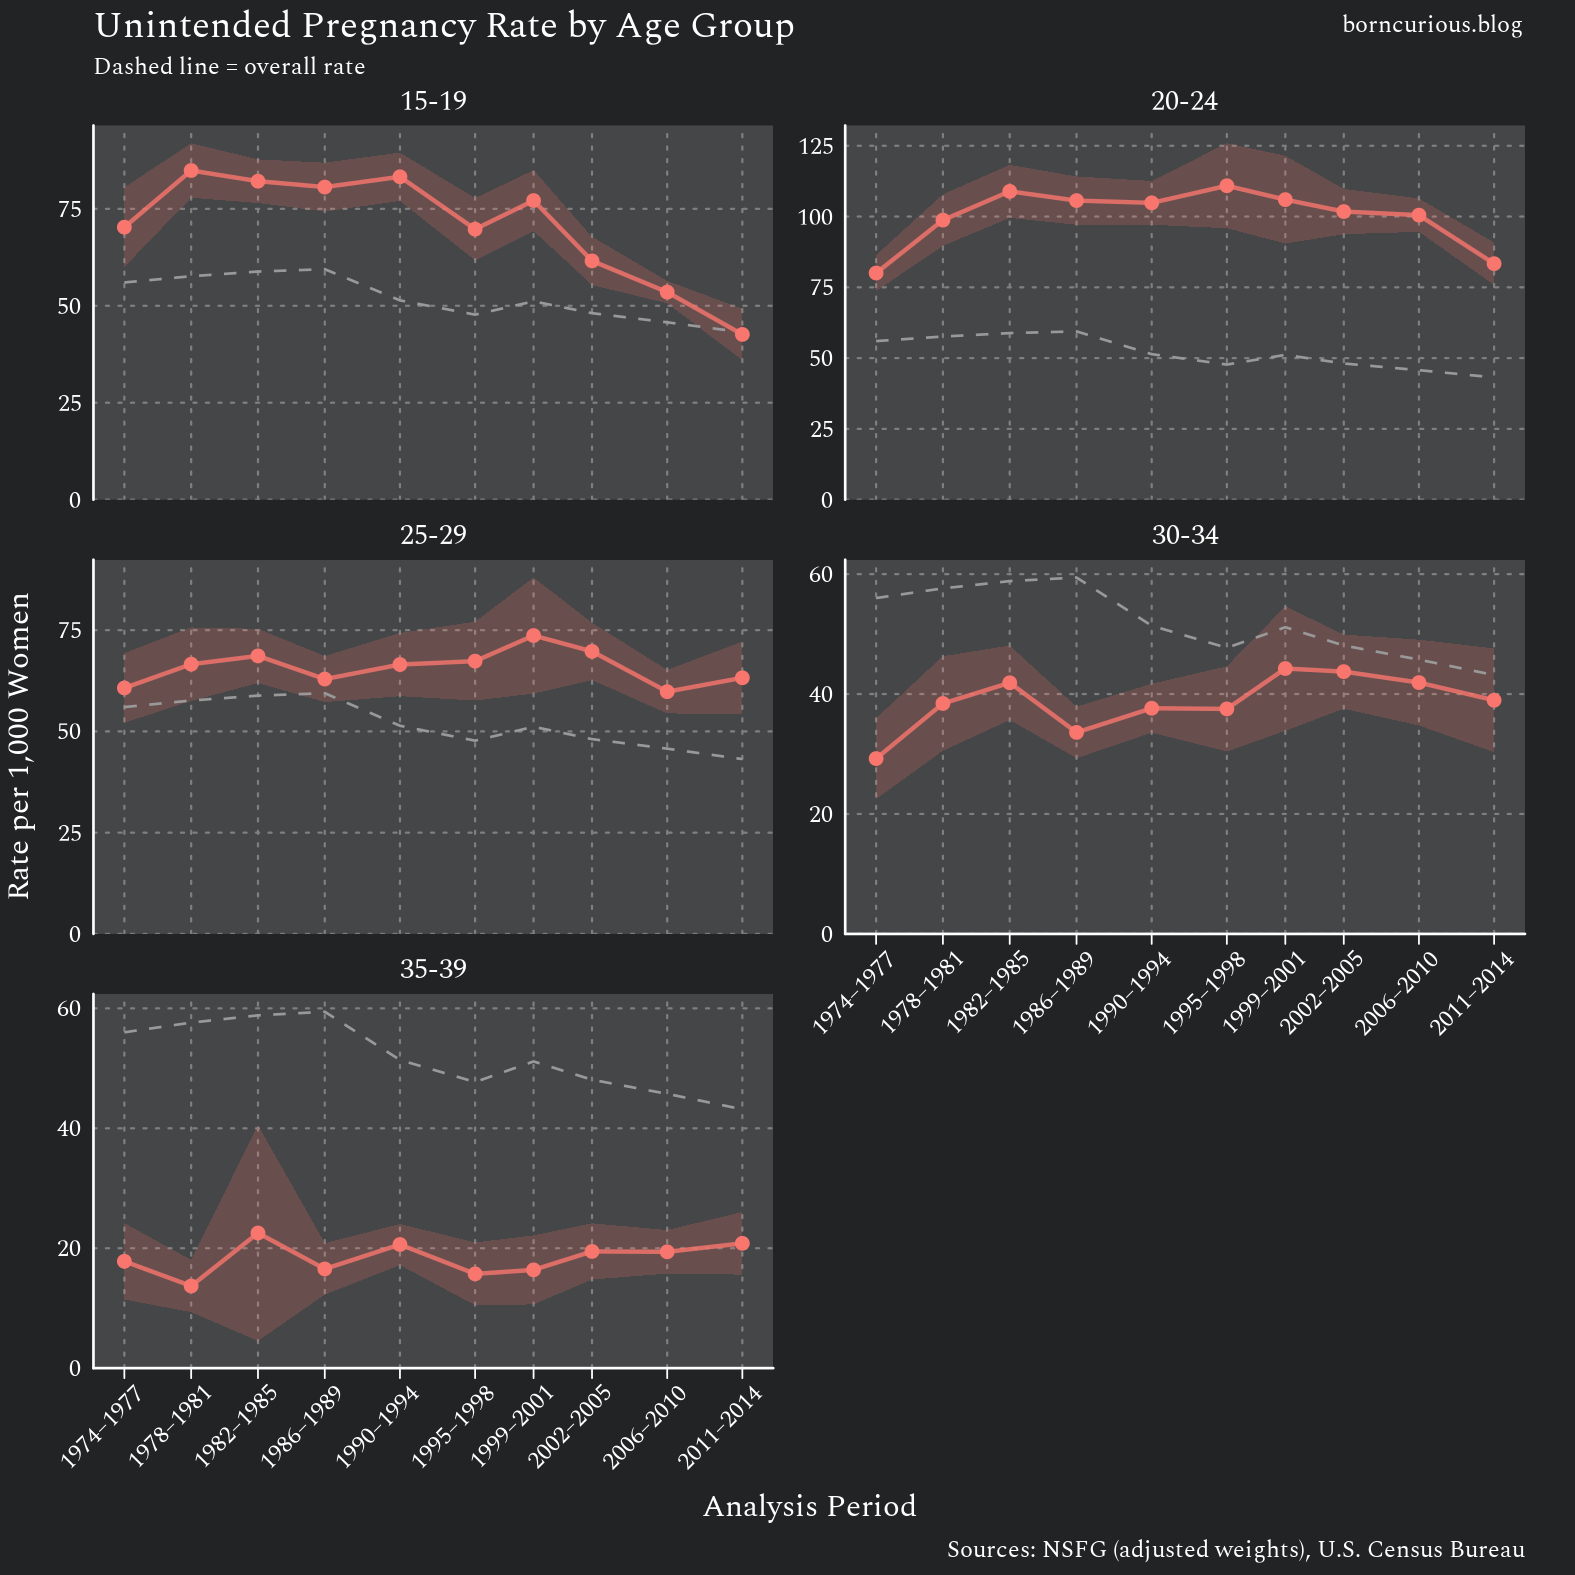
The 40+ age group is not included due to insufficient sample size.
We can see in Figure 1 that the 20-24 year old age group has by far the highest risk of unintended pregnancy. More generally, by comparing the individual trendlines with the dashed grey line, groups 15-19, 20-24, and 25-29 have higher-than-average risk, and ages 30 and over have lower-than-average risk.
Furthermore, we can immediately reject the age-composition hypothesis. The 1970s saw an increase in the rate of unintended pregnancy across almost all the age groups: 15-19, 20-24, 25-29, and 30-34. The surge was real.
While the 1970s surge was across all age groups under 30, the decline after the 1990s occurred primarily among teens aged 15-19. Indeed, this age group had the greatest changes in risk of unintended pregnancy.
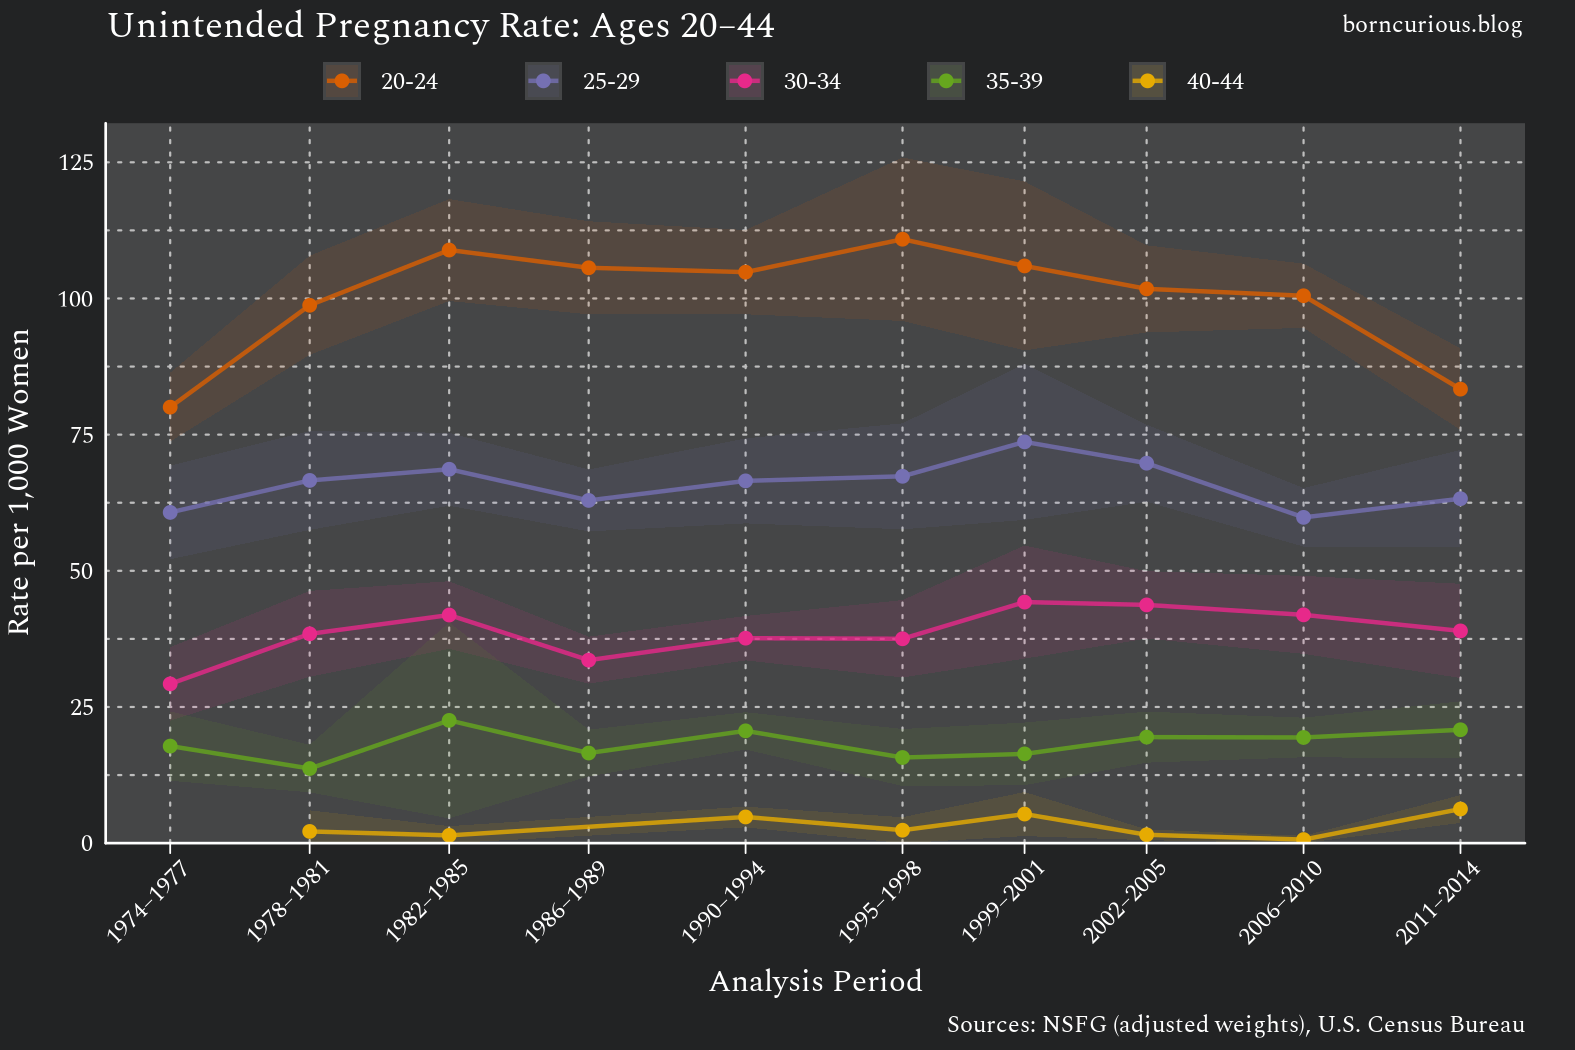
For ages 20 and higher, there is a consistent ordering of risk from younger age groups (with the greatest risk) to older age groups (with the least risk), as seen in Figure 2.
While the overall ordering remained, the spread started to narrow slightly in the 21st century, due to a decline in the unintended pregnancy rate among the highest-risk 20-24 group and, to a lesser extent, a smaller increase in risk among the 35-39 and 40-44 groups.
The Decline in Unintended Pregnancy among Teens
The 15-19 age group is the only one that breaks this younger-implies-higher-risk ordering and is the only age group that changed its ordering relative to the others during this time frame, as depicted in Figure 3.
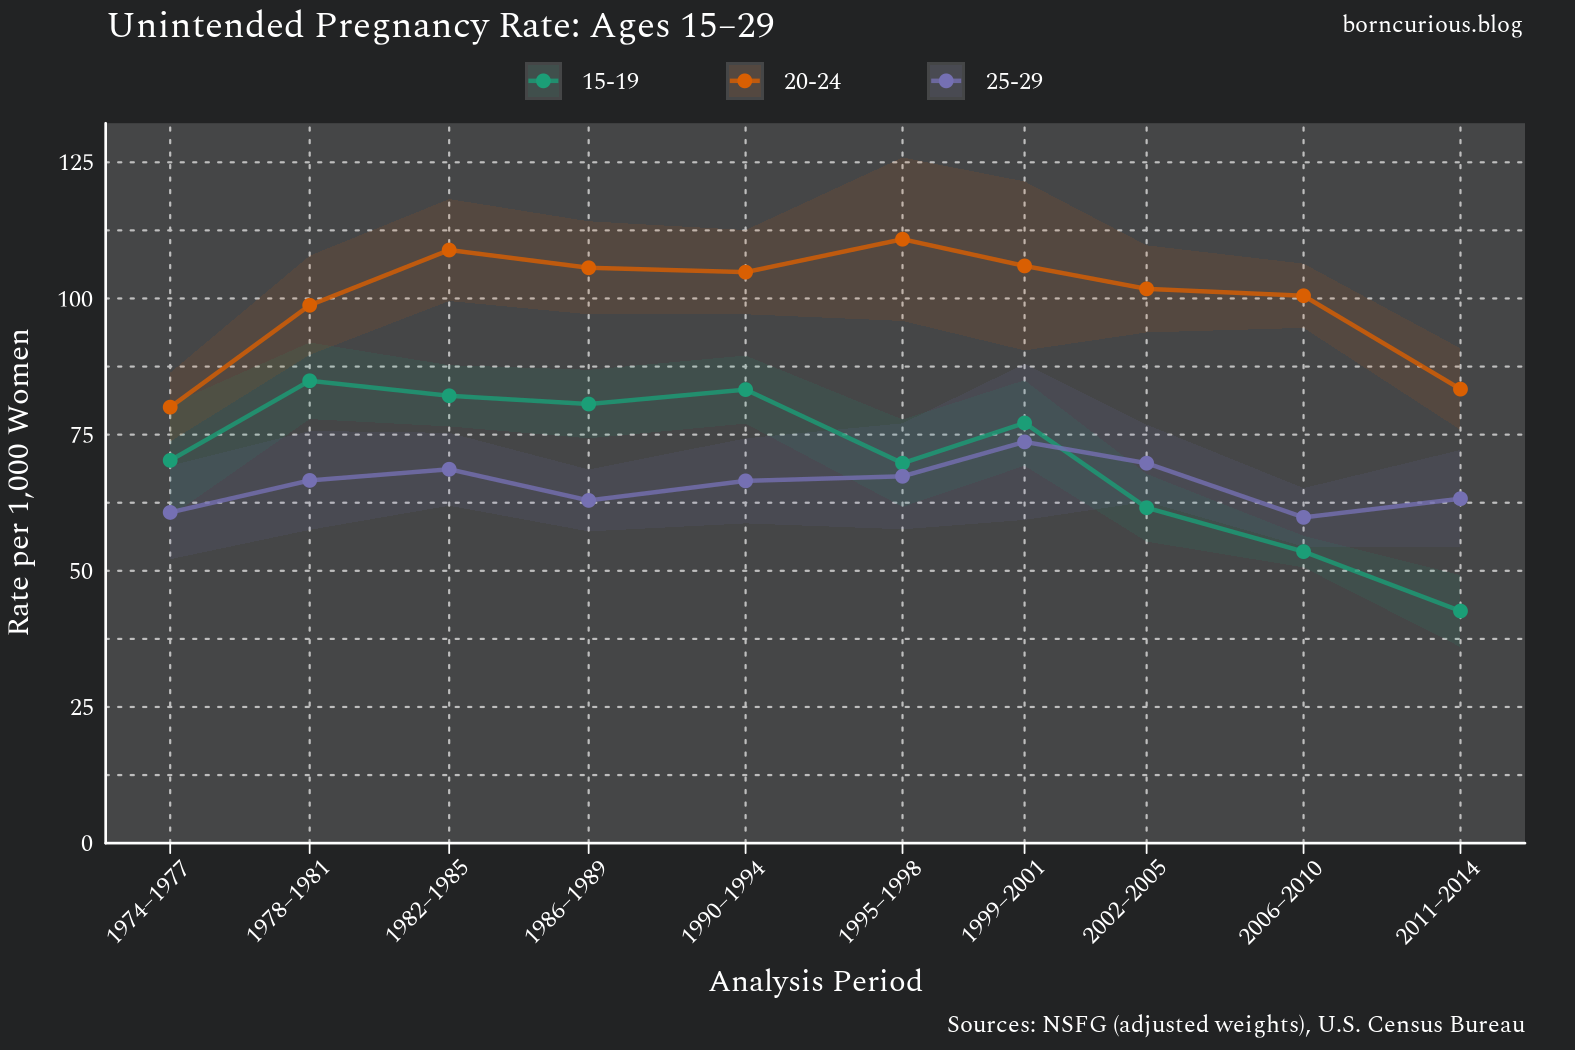
In 1974, the 15-19 age group had a risk for unintended pregnancy greater than the 25-29 age group and less than the 20-24 age group. However, in the 1990s, the unintended pregnancy rate began to decline among 15-19 year olds. By the 21st century, the unintended pregnancy rate of the 15-19 group was consistently lower than the 25-29 group.
This makes sense because reducing teen pregnancy was top of mind in the United States in the 1990s. The nonprofit National Campaign to Prevent Teen Pregnancy was founded in 1996. It was unusual (by 21st-century standards) in that it worked across ideological lines and included advocates of both sex education and abstinence.
Furthermore, these initiatives were not confined to the nonprofit sector; they were also incorporated into public policy. For instance, the 1996 Temporary Assistance for Needy Families (TANF) welfare reform legislation included financial incentives for states to decrease the out-of-wedlock birth rate without increasing the abortion rate, especially among teenagers.
It makes sense that teen pregnancies would get the most attention.
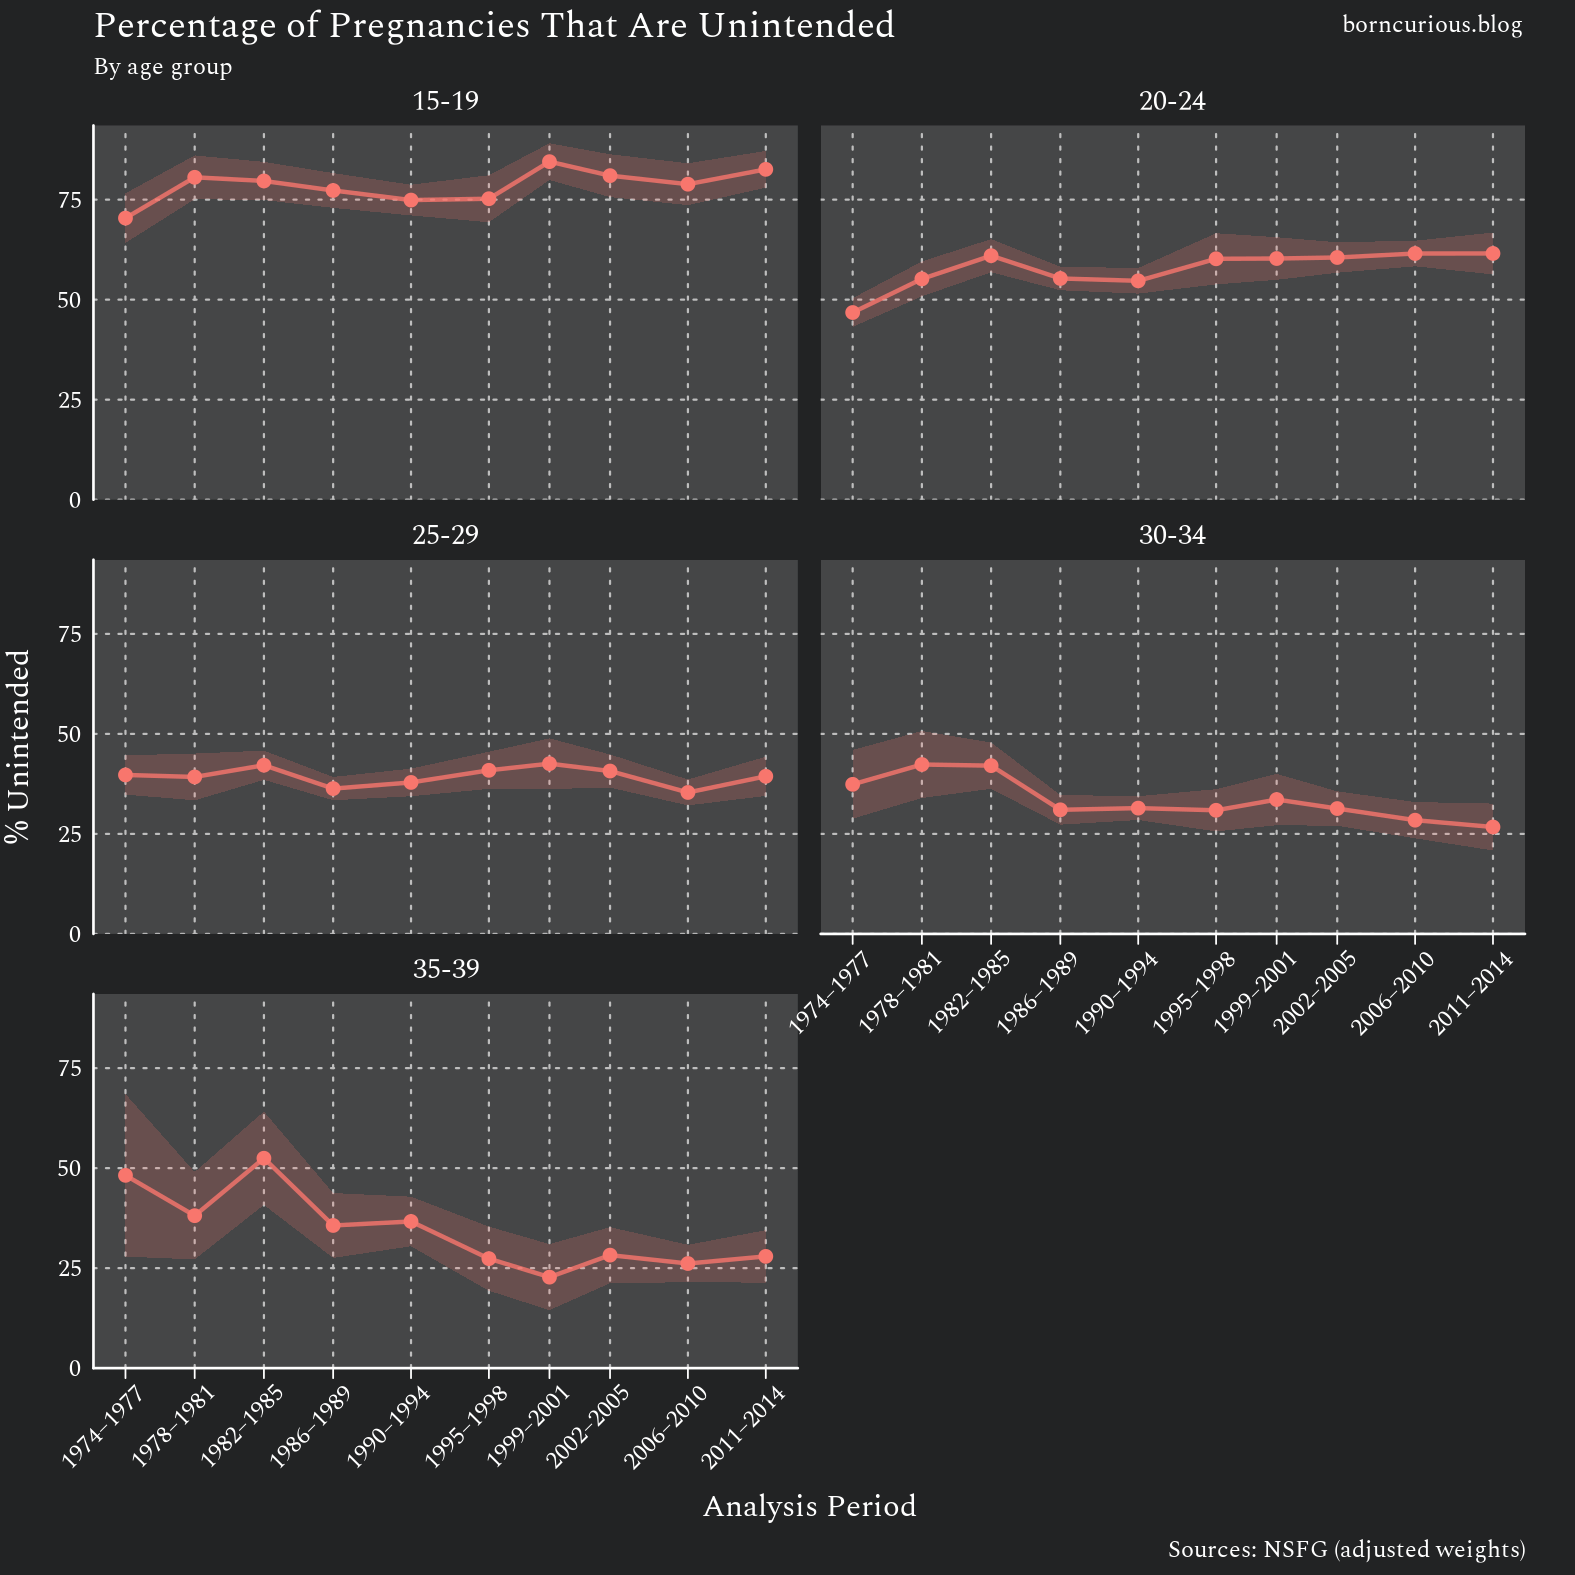
Teens consistently have the highest proportion of pregnancies that are unintended, as seen in Figure 4. Thus, a pregnant teen is — at least three-quarters of the time — a visible sign of social disorder.
However, we should note that a simple majority of pregnancies in the 20-24 age group are unintended. This age group has the highest rate of unintended pregnancy per woman, and this rate has decreased less than the rate for the 15-19 age group. (Figure 3)
The rate for the 15-19 group decreased by about 50% from its peak, whereas the rate for the 20-24 group decreased by about 25%.
Age Composition Changes
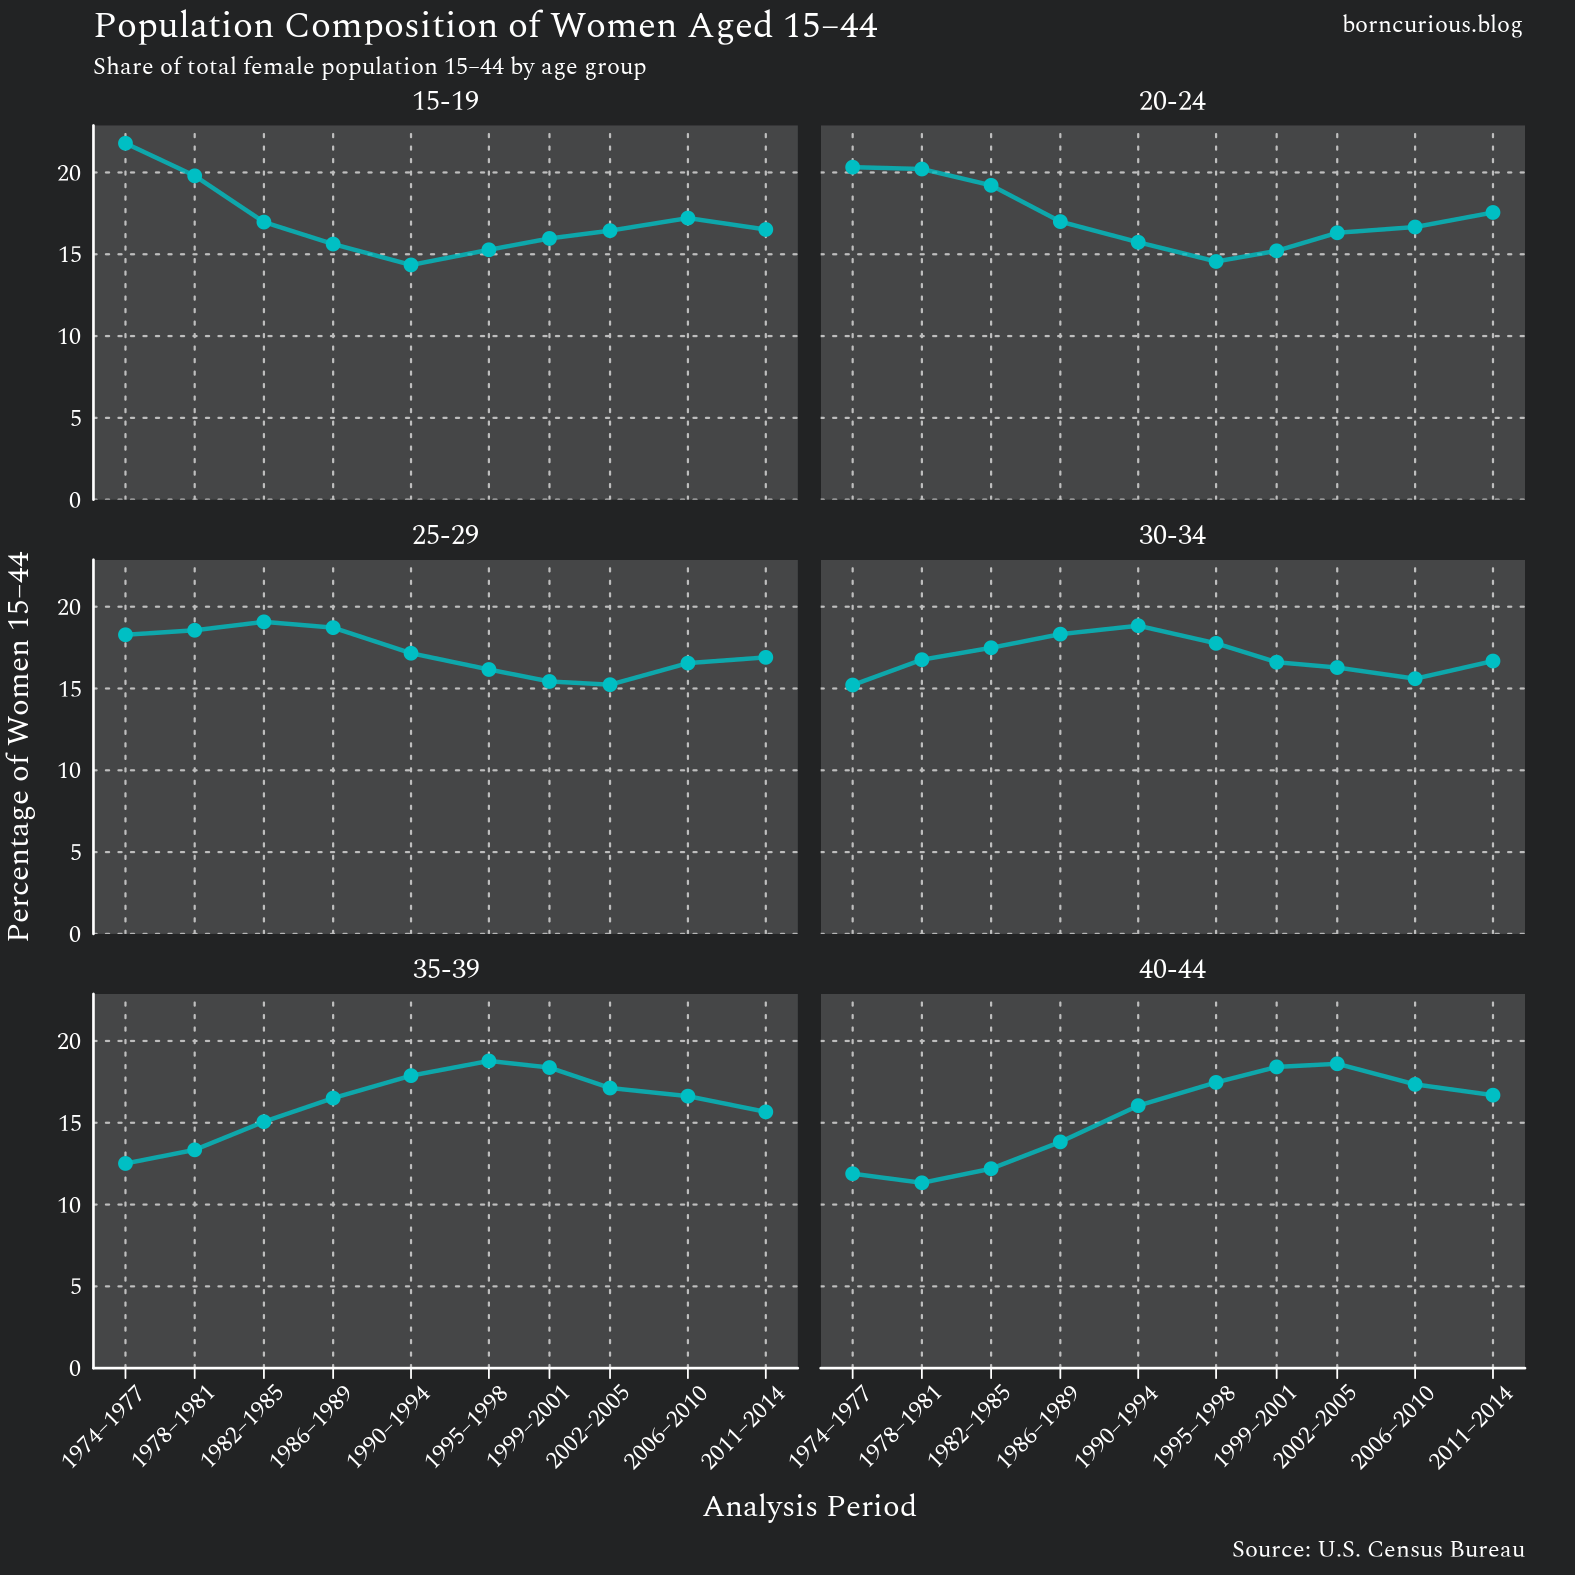
If we look at the age composition of women in the 1970s, we can further reject the hypothesis that the surge in unintended pregnancies was an illusion. (Figure 5) The percentage of the population in their teens — the second-most-at-risk age group — was actually decreasing. The percentage in their 20s was mostly the same. And the percentage in their 30s — when the risk for unintended pregnancy was less than half of that of the younger groups (Figure 2) — was actually increasing.
We can further reject the age composition hypothesis by computing an age-standardized rate. For this, you pick an age composition and calculate what the rate would have been at various times if the age composition remained the same. The trends in the unintended rate remain the same, no matter how you do this. (Not pictured.)
Period Effects, Not Cohort Effects
Finally, whenever investigating age, it is worth checking for cohort effects.
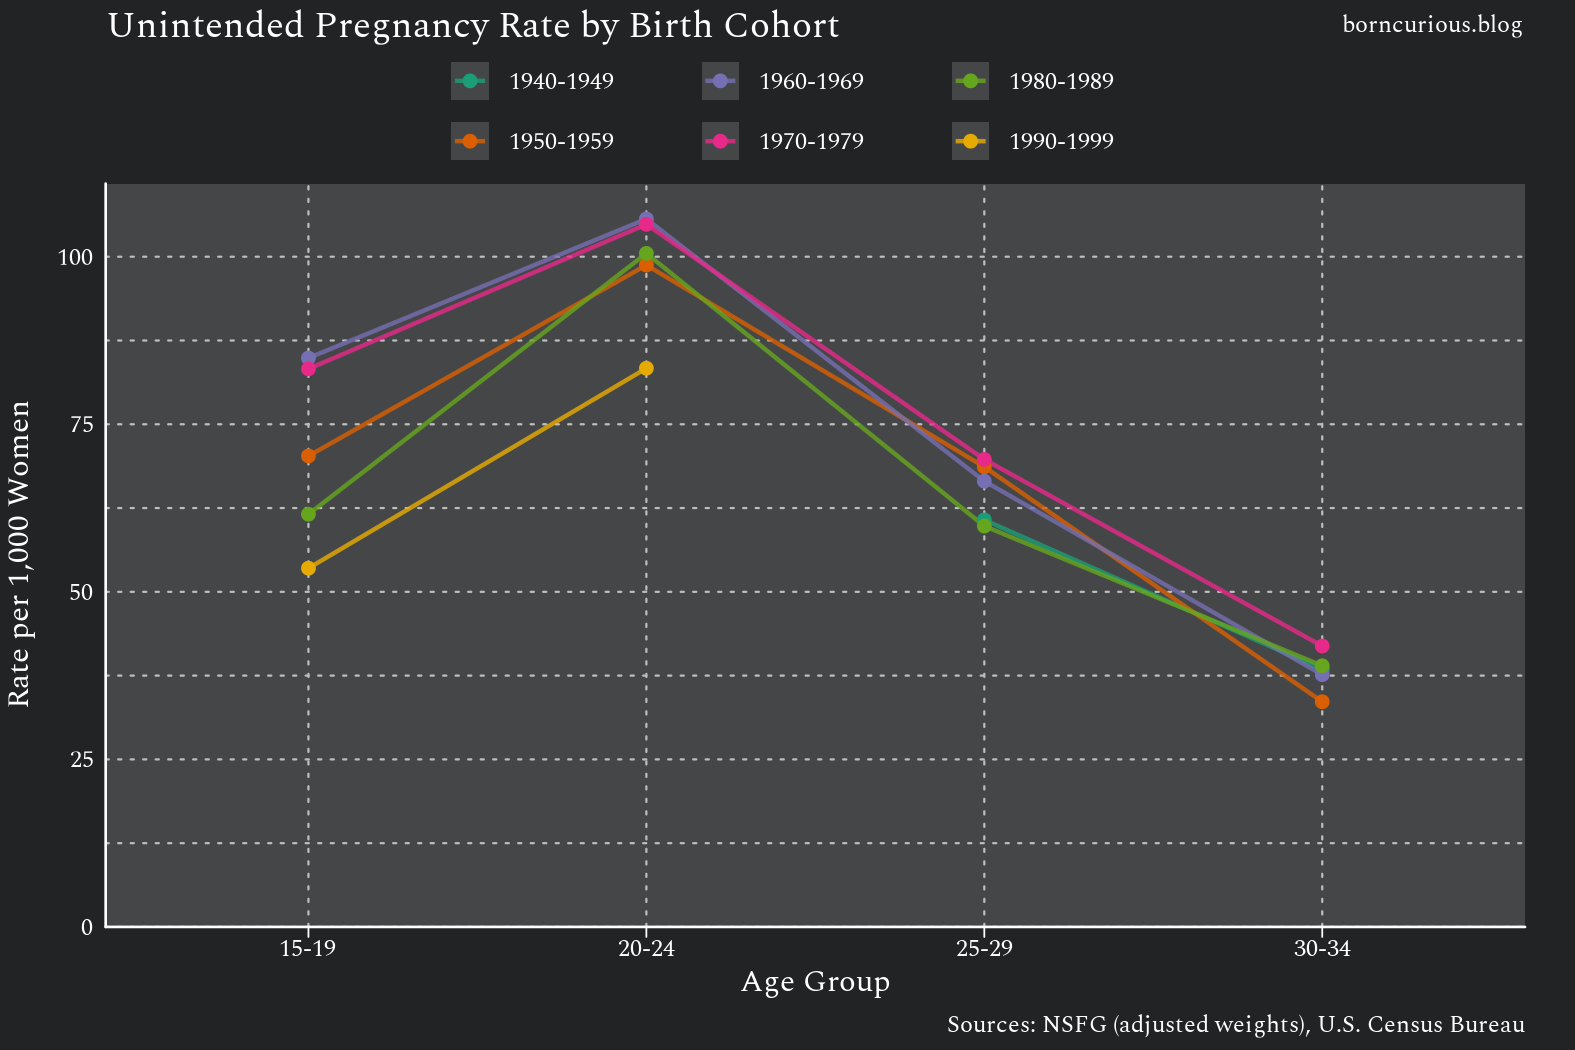
As seen in Figure 6, there are no cohort effects. The trends for each cohort have the same shape and largely overlap. The major differences come from different cohorts being at certain ages when the unintended pregnancy rate was relatively low or high, not from persistent between-cohort differences.
Perhaps the cohort born in 1990-1999, who grew up after the teen pregnancy prevention initiatives of the 1990s, will be the first to have a consistent between-cohort difference, but that remains to be seen.
Conclusion
The 20-24 age group has consistently had the highest rate of unintended pregnancy. Risk for unintended pregnancy declines with each older age group, and this has been relatively stable.
The most dramatic change in our analysis period has been among the 15-19 age group, which went from a higher unintended pregnancy rate than the 25-29 group to a consistently lower one.
The surge in the per capita rate of unintended pregnancy in the 1970s was real, not a demographic illusion. The increase occurred across nearly all age groups, and the changes in age composition of women actually worked against the surge.